Downstream processing of monoclonal antibodies uses large volumes of buffer, and each litre starts as high-purity water. A group at Lund University has tested an idea that is established as solvent recycling in solvent-based pharmaceutical processes and still rather unexplored in water-based ones: collect spent buffer, correct it, and use it again. The first paper (Journal of Chromatography A, January 2025) recycled equilibration buffer in Protein A capture. A second paper (Processes, November 2025) extended the idea to cleaning-in-place (CIP) buffer across two integrated steps.
A note on sources: the publishers’ sites block our servers, so we read the two abstracts on Lund University’s portals and the full method in Madelène Isaksson’s doctoral thesis (Lund University, February 2025), which includes the first paper. Each figure below says where it comes from.
How much buffer a downstream train uses
The thesis gives measured numbers for the group’s lab-scale and pilot-scale integrated continuous downstream processes, each with three chromatography steps. One periodic counter-current (PCC) capture cycle plus both polishing steps used 145 mL of buffer at lab scale and 8,451 mL at pilot scale, producing on average 16 mg and 2.6 g of purified mAb per cycle. That is 9,030 kg and 3,250 kg of water per kg of product. Including pump washes, daily buffer use was about 5 L and 100 L.
The author then extrapolates: at 3,250 kg water per kg product, the harvest from a 1,000 L perfusion bioreactor at 1.5 vessel volumes per day and 2 g/L average titer would need 10,000 L of buffer per day. That is an estimate from the thesis, not a plant measurement, but it shows why buffer volume becomes a facility constraint.
The equilibration buffer scheme
The Protein A protocol ended each cycle with 3 column volumes (CV) of 0.5 M NaOH for CIP, followed by 5 CV of equilibration buffer. Fractions collected during equilibration showed that conductivity stabilized before pH, at 2.6 to 2.7 CV depending on system delay volumes. The design follows from that:
- Recovery. From 2.7 CV to 5.0 CV, the column outlet goes to a buffer recycle flask. Its pH is above setpoint and is corrected with acidic buffer.
- Reuse. In the next equilibration, the recovered buffer feeds the first 2.3 CV. Fresh buffer is used for the rest.
- Constraints. Reuse and recovery never overlap, to prevent the same buffer being recovered several times and impurities accumulating in the flask; the two phases have equal volumes so the flask stays at steady volume. The result is a 0.4 CV buffer zone between them, and a saving of 2.3 of every 5.0 CV.
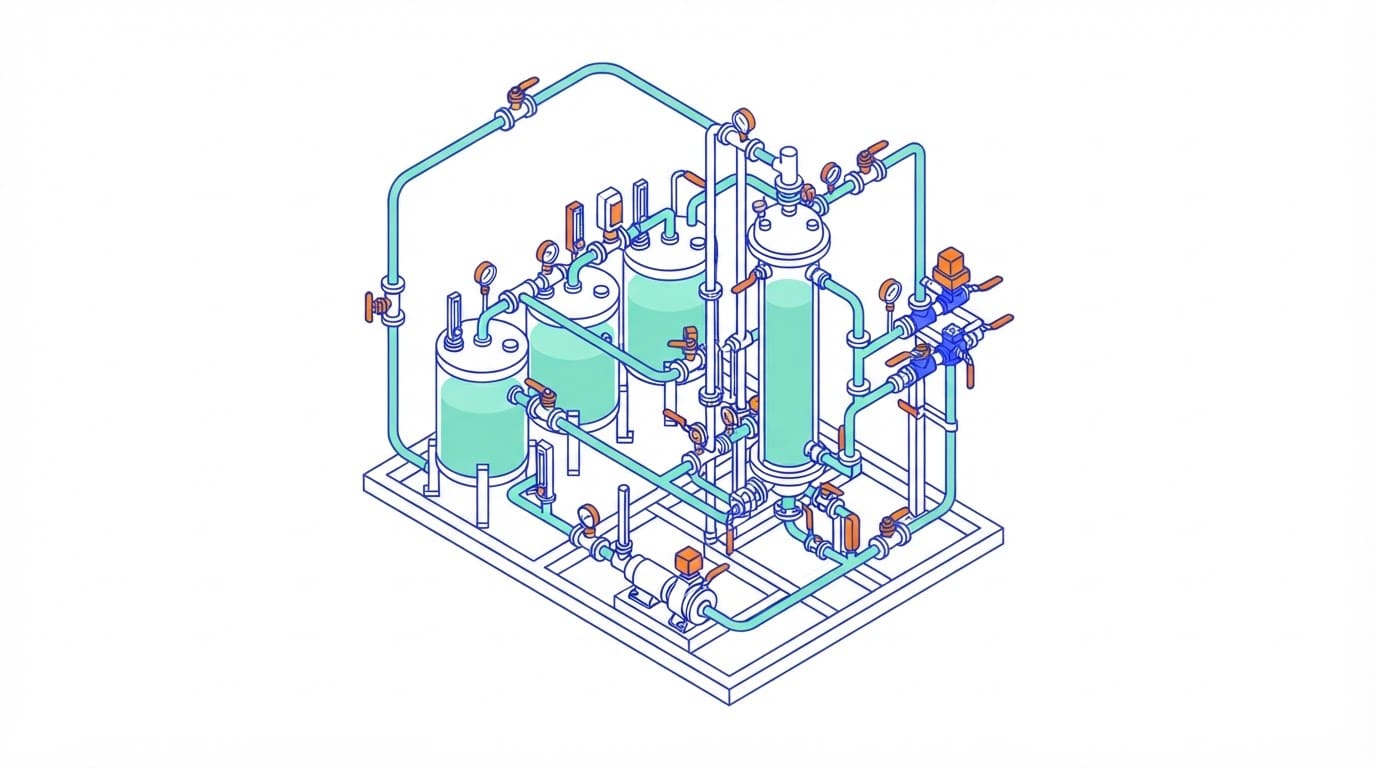
- Hardware. Because recovery and reuse happen at different times, the scheme needs a batch-to-batch or multi-column process. It was run single-column and in a 3-column PCC on an ÄKTA pcc, with an external pH sensor in the recycle flask and automatic pH adjustment.
Results and their limits
The thesis reports a 45% cut in equilibration buffer in that phase, more than 10% of total buffer in the Protein A protocol; the journal abstract rounds it to almost 50%. Analytical SEC detected no change in yield or purity, and no impurities in the recycle flask, which the author qualifies with “although the analytical methods had limited power”. A first look at sensor-based control, using in-line conductivity and pH after the column instead of fixed volumes, suggested the saving could rise to nearly 60%. The PCC evaluation itself was short: two cycles with recovery only, then two with recovery and reuse.
The November 2025 paper moved to CIP in an integrated two-step process: Protein A capture in PCC mode followed by mixed-mode polishing in flowthrough. CIP buffer from the polishing column was recovered and reused counter-currently in the CIP phase of the capture column. Against a reference process, this saved 29% of CIP buffer, with purity within 0.66% and yield within 1.68% of the reference, according to the abstract.
What it means for a plant
The low-risk candidates are phases where spent buffer is close to fresh buffer, such as the tail of equilibration, and CIP streams reused further upstream in the train, where the thesis notes some impurities can be tolerated because they are already present there. The equipment is modest: in-line conductivity and pH, a recycle vessel with pH correction, and sequencing in the chromatography controller. The validation burden is not modest. A GMP site would need impurity carryover analytics more sensitive than the SEC used here, longer campaigns than four PCC cycles, and a hold and bioburden strategy for recovered buffer; the sources we read do not address bioburden of recovered buffer. The savings are per phase: 45% of equilibration buffer is roughly a tenth of Protein A buffer, not a tenth of plant water.
Sources
- Isaksson M., Andersson N., Nilsson B., Improving the sustainability of biopharmaceutical downstream processing through buffer recycling, Journal of Chromatography A 1740, 465545, 11 January 2025 (abstract read on the Lund University research portal).
- Isaksson M., Integrated Continuous Downstream Processing of Biopharmaceuticals, doctoral thesis, Lund University, 28 February 2025.
- Lorek J. K., Isaksson M., Nilsson B., Buffer Recycling in an Integrated Antibody Downstream Process for Improved Sustainability, Processes 13(11), November 2025 (abstract read on Lund University Publications).