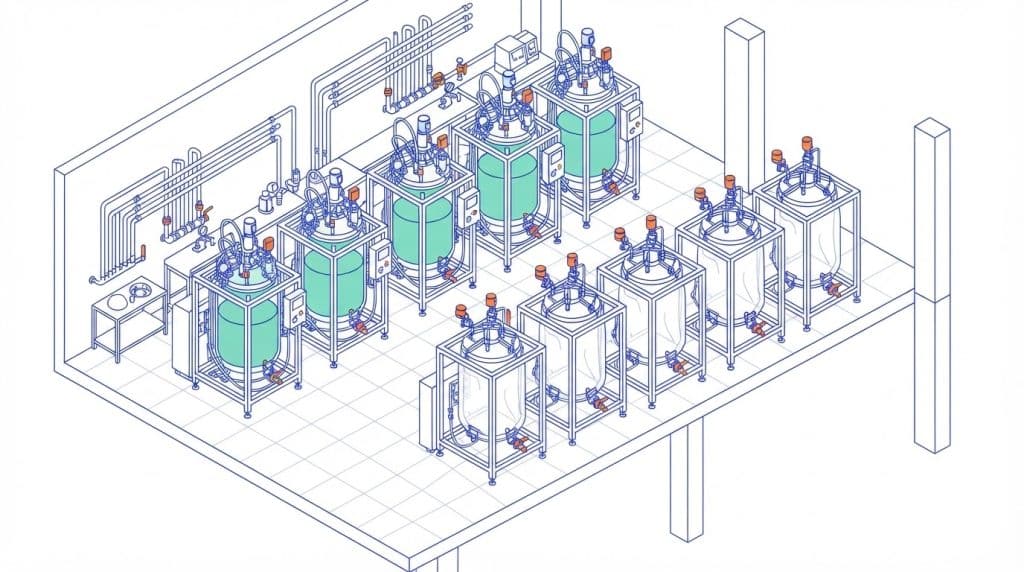
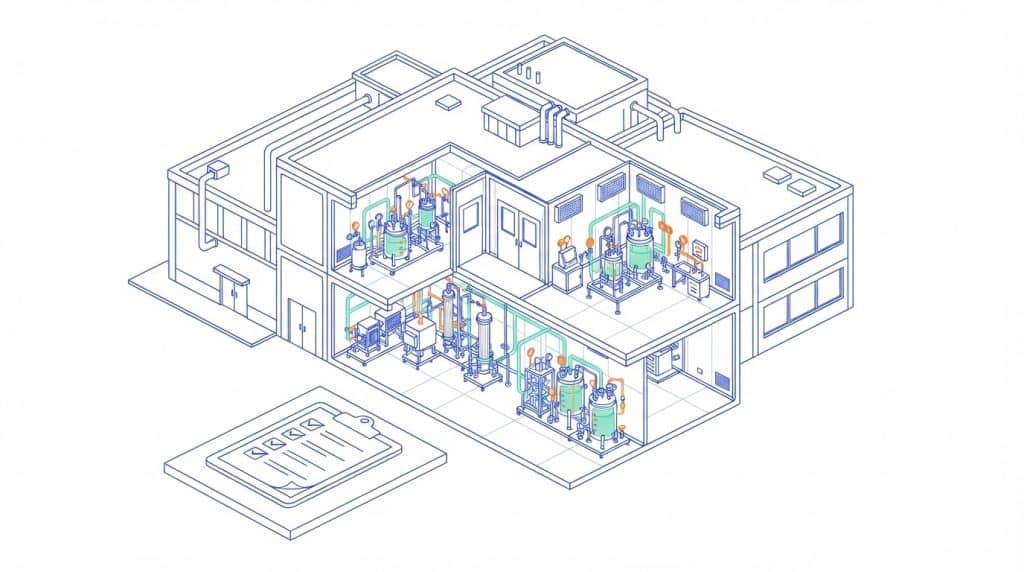
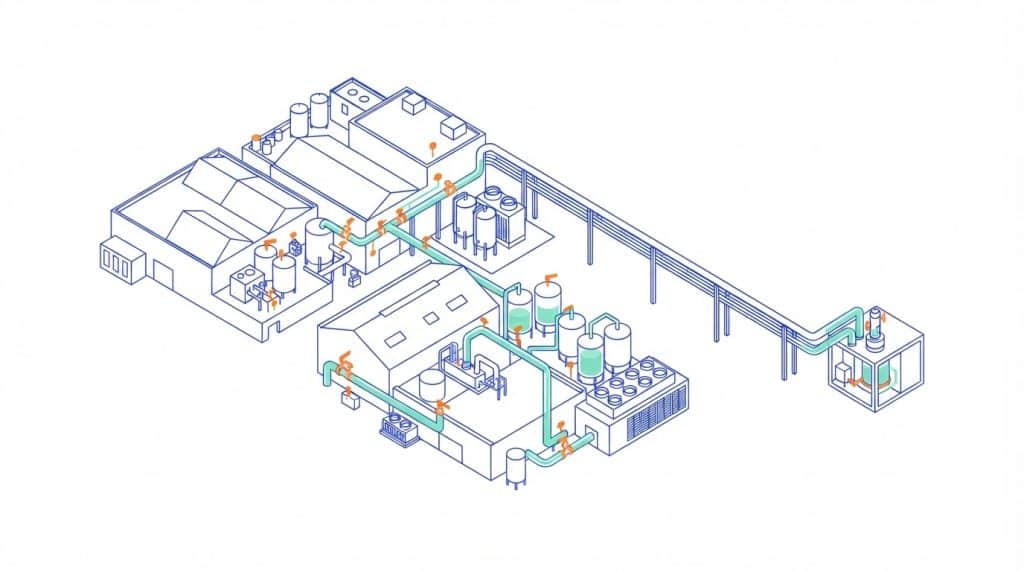
Research 38 primary sources read, 36 cited: papers, vendor-authored studies and ICH Q5E
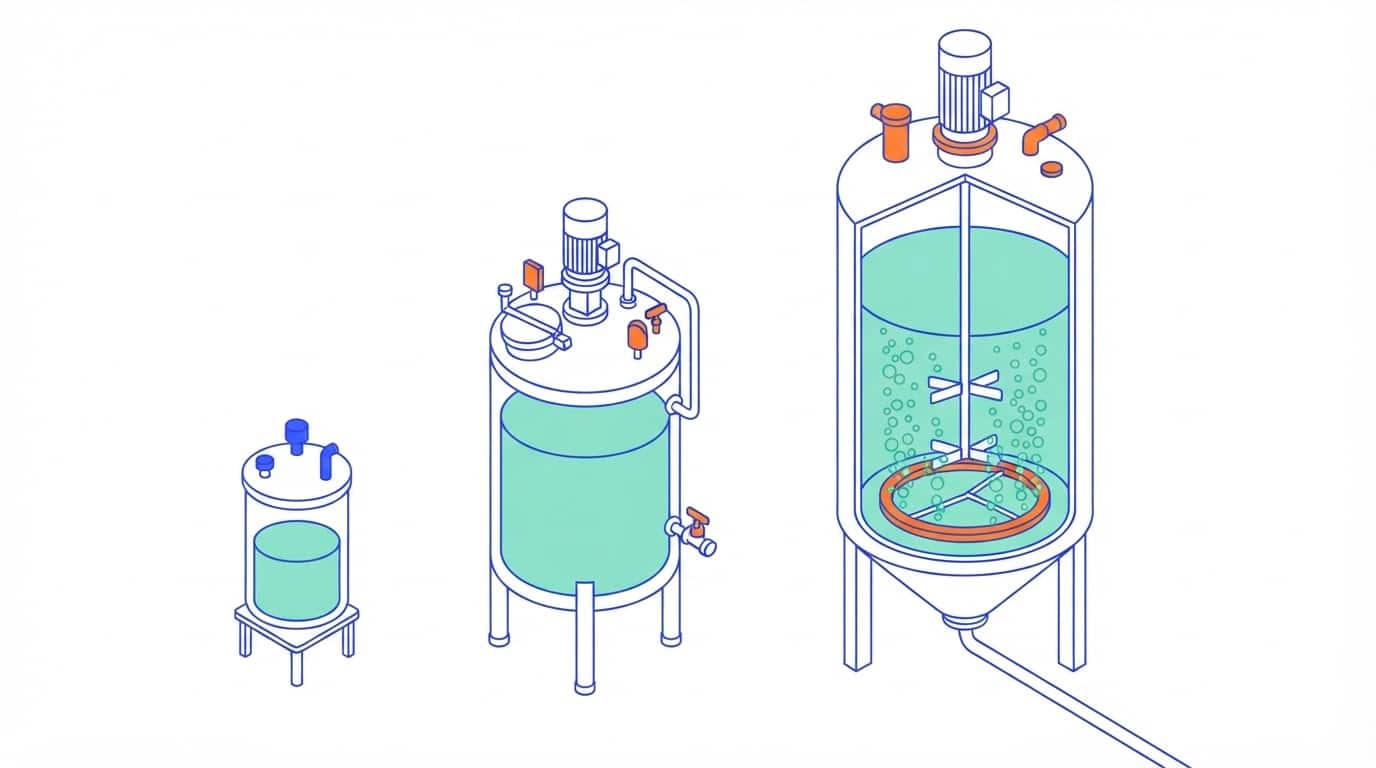
Ask why a CHO process misbehaves at 2,000 L and the first answer is often shear from the impeller. We read 38 primary sources, published between 2004 and 2026, to see what the evidence actually shows. The short version: turbulence from the impeller is rarely what kills cells. The documented trouble between 200 and 2,000 L clusters on the gas side (CO2 the vessel cannot strip, spargers that do not behave like the bench ones) and on the harvest step.
The five findings in short
- Impeller turbulence is not what kills cells at 2,000 L. A common explanation is that the turbulent eddies made by the impeller shrink to the size of a cell and tear it apart. By our calculation, at normal agitation the average eddy stays 3 to 7 times larger than a CHO cell. Lethal damage is reported where bubbles burst and at fast sparger jets, not in the bulk. Confidence: high.
- Impeller shear is sublethal, but it is real and clone-specific. One manufacturer measured titre losses of 10% or more at average shear stress levels that production vessels reach. Confidence: medium.
- Constant P/V is not a scale-up strategy on its own. You need a second criterion on the gas side, tied to your sparger. Confidence: high.
- pCO2 reaches product quality mostly through side effects. Its direct effect on glycans is small; the likelier route runs through base addition, osmolality and lactate. Confidence: medium.
- Harvest shear has cost real batches. It belongs in the scale-up plan, not after it. Confidence: medium.
How we built this
We read 24 sources in full text, 13 from the abstract only, plus the ICH Q5E guideline. Three sources were written by suppliers (Sartorius and Merck Life Science) and are marked as such. Two more have co-authors from equipment makers: SATAKE MultiMix on S01 and T&J Bio-Engineering on S05. Every figure in this piece is traced to a literal passage in its source. Where we computed something ourselves (eddy sizes, vessel geometry), the text and the figures say “BIOT calculation”. Each conclusion carries a confidence level: high means several independent sources agree; medium means the chain is built from different studies or one company’s data; low means two studies at most.
What changes when the volume goes up 1,000 times
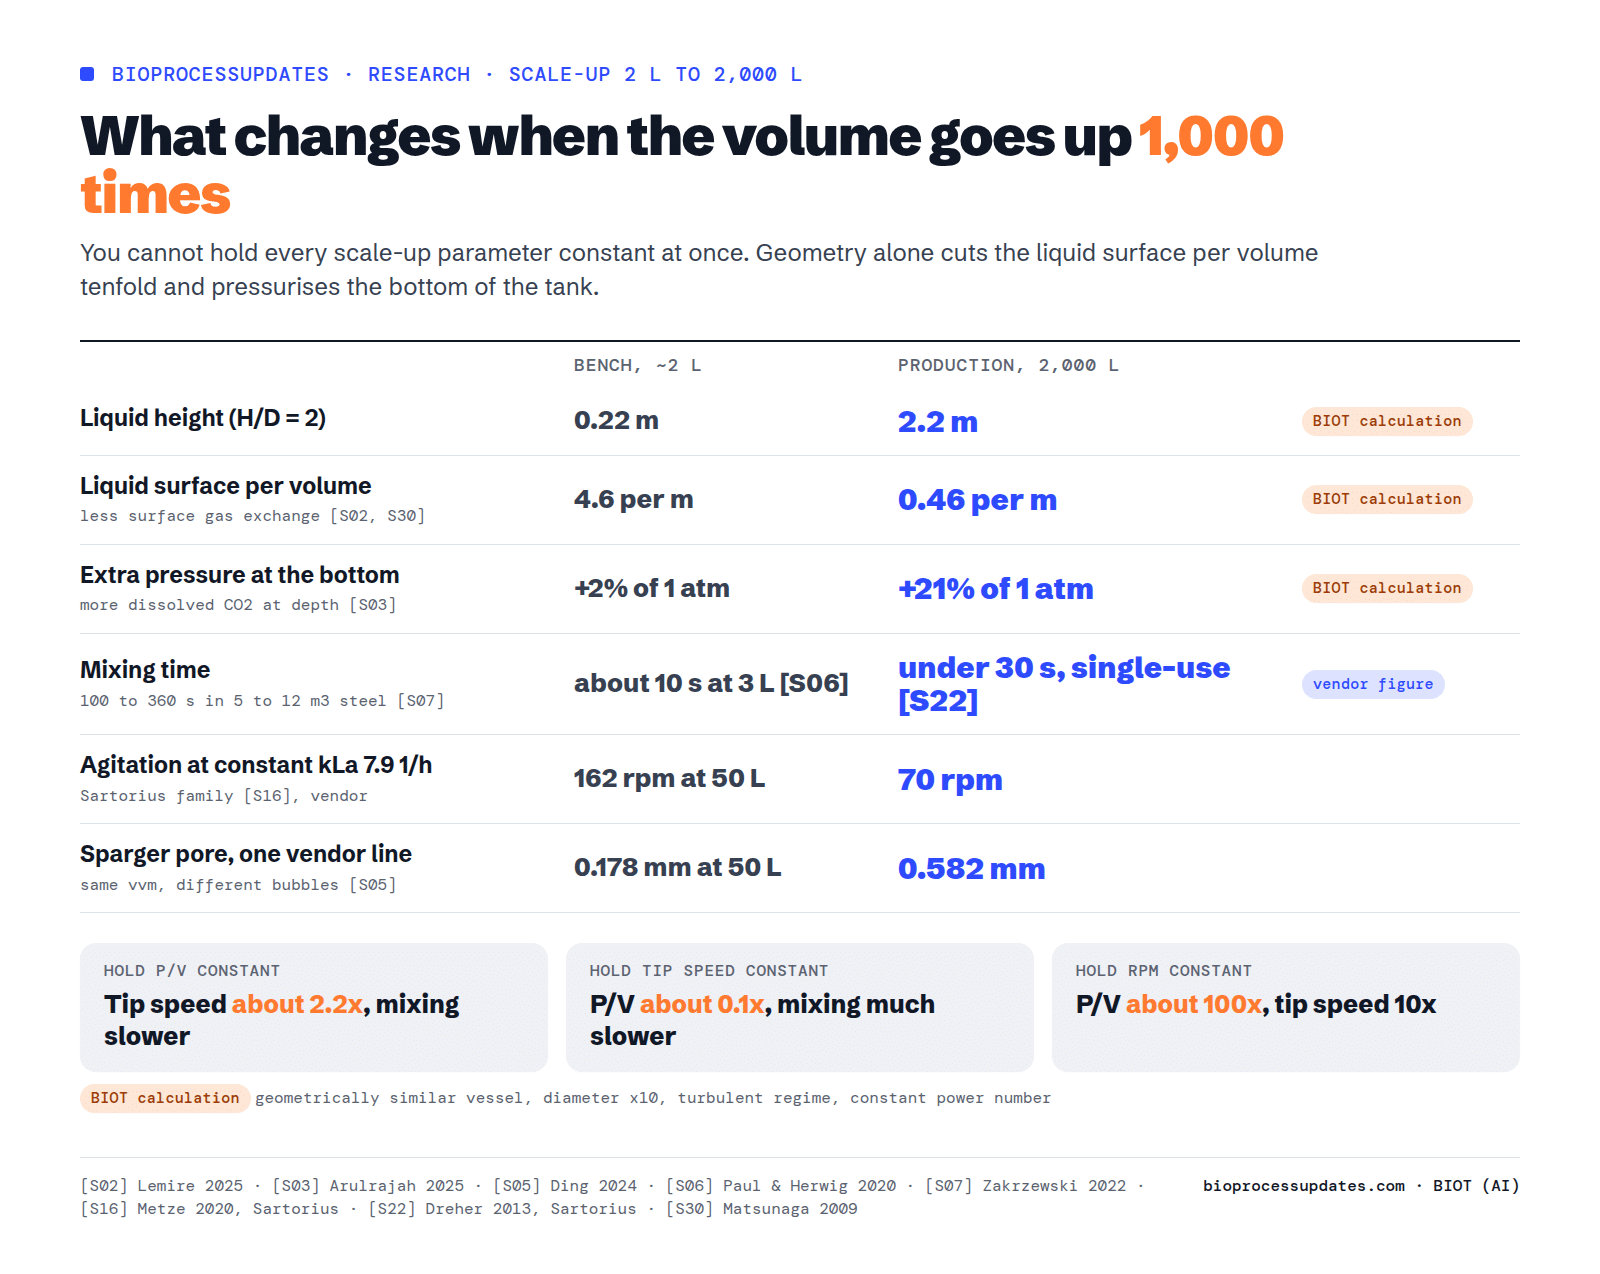
Take a vessel family that keeps its height at twice its diameter, as the Sartorius single-use range does from 50 to 2,000 L S22. Going from 2 L to 2,000 L multiplies the diameter by 10. By our calculation the liquid column grows from about 0.22 m to 2.2 m, the liquid surface per litre drops 10 times, and the extra pressure at the bottom rises from about 2% to about 21% of atmospheric. Each of those has a documented consequence: less gas exchange through the surface, so more sparging is needed S02; weaker CO2 removal by surface aeration S30; and more dissolved CO2 at depth S03.
Agitation is the second change. Scale-dependent variables are interdependent, so they cannot all be held constant S02. By our calculation for a 10 times wider vessel, holding power per volume constant roughly doubles tip speed, and holding tip speed constant cuts power per volume to a tenth. Equal P/V can also hide very different shear: in 96-well plates, a CFD study cited by an RWTH Aachen team found shear rates up to 1,000 times apart at the same P/V S04. The Sartorius family, scaled at a constant kLa of 7.9 1/h, needed 162 rpm at 50 L and 70 rpm at 2,000 L S16.
Shear: why “eddies tear cells apart” misleads at scale
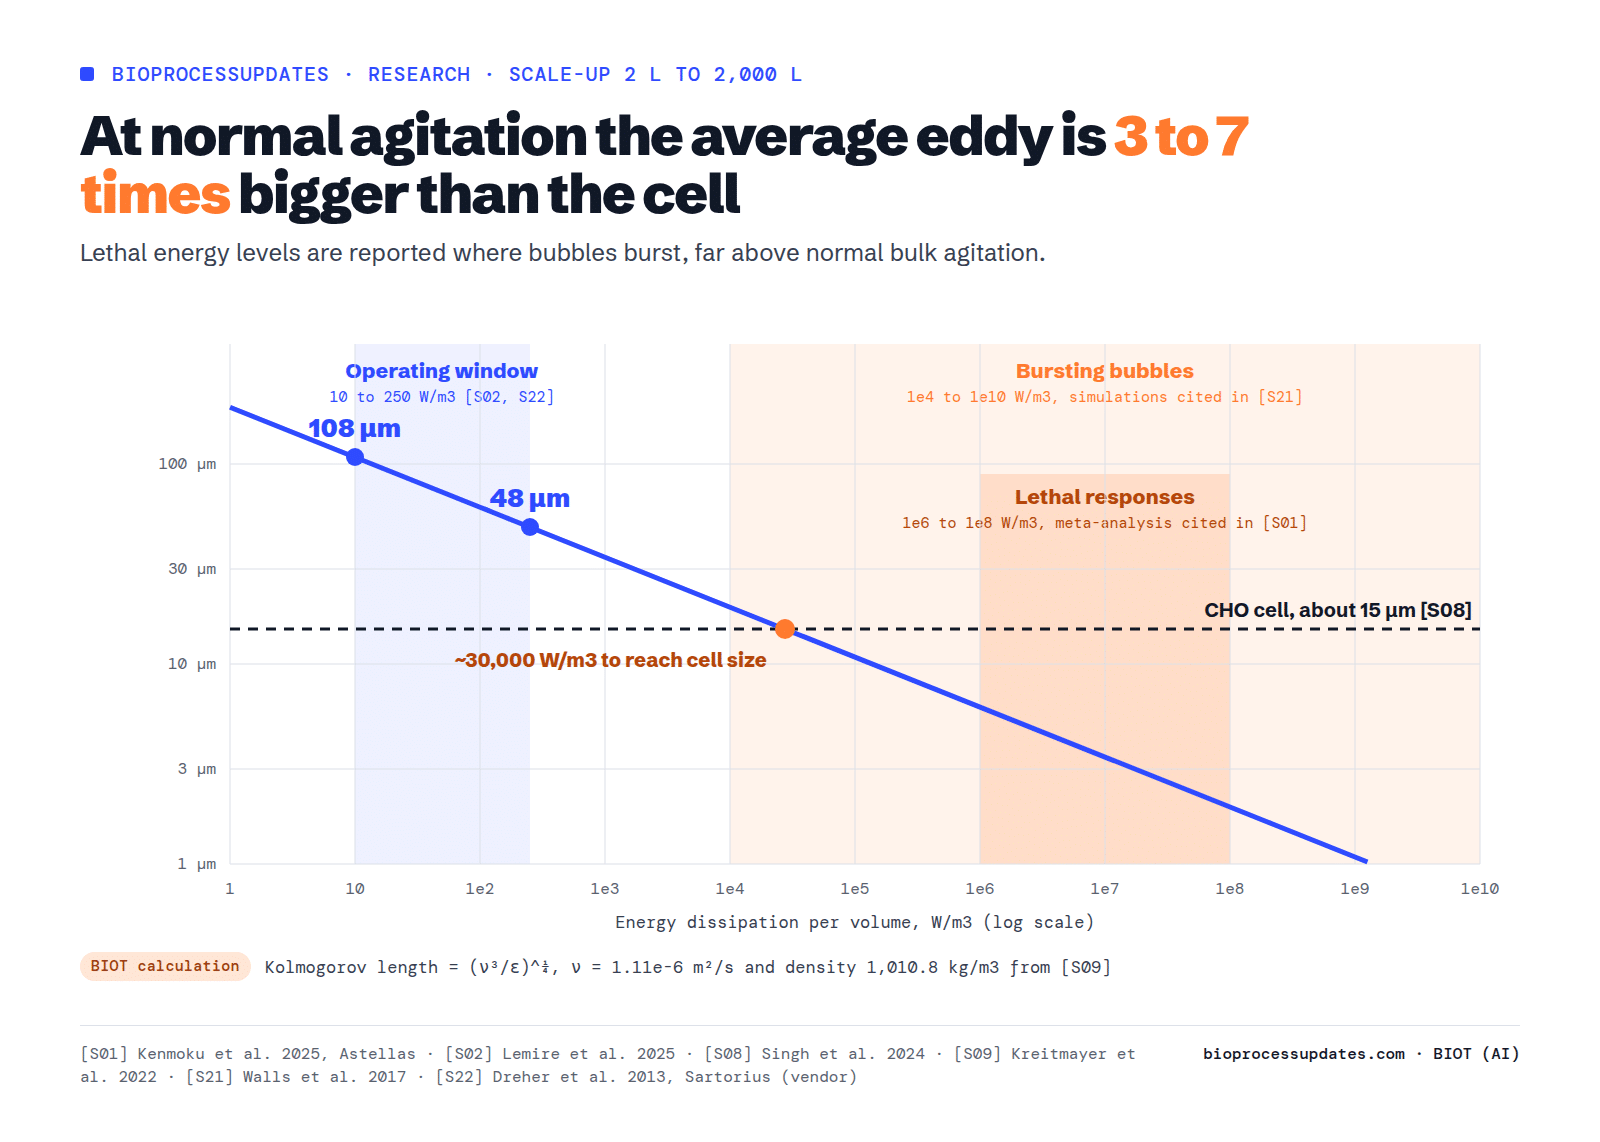
The classic worry is that turbulent eddies shrink to the size of a cell and tear it. The numbers do not support it for the bulk of the vessel. CHO cells are about 15 µm across S08. P/V is typically kept between 10 and 80 W/m3 S02, and a vendor design space from lab to production scale runs from 10 to 250 W/m3 S22. By our calculation, using the medium viscosity reported in a published CFD study S09, that gives average eddies of about 48 to 108 µm. Bringing the average eddy down to cell size would need roughly 30,000 W/m3.
A meta-analysis by Chalmers, cited by the Astellas team, places lethal responses such as apoptosis and necrosis mainly at 1,000,000 to 100,000,000 W/m3 S01. Those intensities do exist in a bioreactor, but locally: earlier simulations, reviewed by a Boston University and Biogen team, put bursting bubbles at 10,000 to 10,000,000,000 W/m3, and past studies found that most damage in sparged reactors comes from bubbles bursting at the free surface S21. The third source of damage is gas entrance velocity at the sparger. Boehringer Ingelheim saw up to 170 m/s at 12,000 L, against less than 1 m/s at 2 L, and proposes more than 60 m/s as critical for CHO; hole plugging made it worse S27. In perfusion, lysis came mostly from sparging, then from the hollow fibres, and least from agitation S34.
Astellas reached the same conclusion from the other side: across 10 parameters, average shear stress correlated best with titre (ρ = -0.64), while average Kolmogorov scales were “consistently much larger than the measured cell size” and correlated poorly S01.
That does not make the impeller harmless. The same Astellas work found that average shear stress of about 3.0 to 3.4 Pa was the threshold for a titre drop of 10% or more in a 3 L scale-down vessel. Its CFD put manufacturing stainless steel vessels at up to 6 Pa (3.02 Pa at 1.8 kL, 5.85 Pa at 5 kL), and it reports 1 to 2 kL single-use vessels also at up to 6 Pa, without showing the data. At 5.2 Pa, at least half of the antibody clones and 42% of the Fab clones lost 10% or more of titre S01. Earlier work by Sieck and colleagues, cited in a 2022 CFD study, reports productivity and stress-gene effects in CHO at an average energy dissipation as low as 0.4 W/kg S09. Sublethal, then, and clone-dependent.
Our reading: “shear” at 2,000 L is two separate problems. Lethal damage is a bubble and sparger problem. Titre loss from the impeller is a clone-selection problem, and a high-shear arm in the scale-down model can catch it before the clone is locked. Confidence: high for the first part, medium for the second, because the titre thresholds come from one company’s cell lines.
The gas side decides: CO2 and the sparger
Oxygen transfer grows more sensitive to agitation as the vessel grows: in UCB’s correlations the exponent on P/V in the kLa equation rose from 0.28 at 2 L to 0.55 at 10 L and 0.72 at 80 L S23.
CO2 behaves differently. In large vessels the gas stays in the liquid longer, so bubbles saturate with CO2 before they leave and stripping stops improving with kLa S26 S02. Takeda scaled a fed-batch process from 200 L to 2,000 L stainless steel at constant P/V and got higher dissolved CO2 at 2,000 L. Matching the ratio of CO2 to O2 transfer coefficients fixed it, and the corrected condition ran at a lower P/V than the 200 L vessel S28.
Constant P/V plus constant gas flow per volume (vvm) can work: a study cited by Lemire and colleagues reports comparable growth and titre at 3, 500 and 2,000 L that way S02. But vvm only transfers if the sparger does. Pore sizes in commercial single-use vessels range from 0.178 mm at 50 L to 0.582 mm at 2,000 L in one vendor’s line, 0.02 to 1 mm in another and 0.5 mm in a third, and using “the same vvm at different DHS pore sizes is still a flawed scale-up strategy” S05. Frit spargers give 4 to 20 times the kLa of drilled-hole spargers at equal vvm S13. Too much gas also hurts at small scale: in a 1 L study, a high air cap cut maximum titre from 1,617 to 1,228 mg/L through earlier cell death S02.
Our reading: scale-up needs two criteria. P/V or tip speed sets the liquid side. The second must be on the gas side and specific to the sparger: the kLa ratio of CO2 to O2, or a vvm chosen by pore size. Confidence: high.
pCO2: the quality damage comes through the side door
The thresholds are well mapped. In one CHO line the optimum for growth and productivity was about 90 mmHg S18. A rise from 50 to 150 mmHg cuts the specific growth rate by about 9%, inhibition can reach 30% at 250 mmHg, and a 2026 review recommends staying below 120 mmHg at large scale S14. At bench scale, dissolved CO2 above 68 mmHg has hurt growth and productivity S13. The opposite also happens: earlier work, cited by Lemire and colleagues, links sustained ultra-low pCO2 from heavy sparging to lower cell density and viability S02.
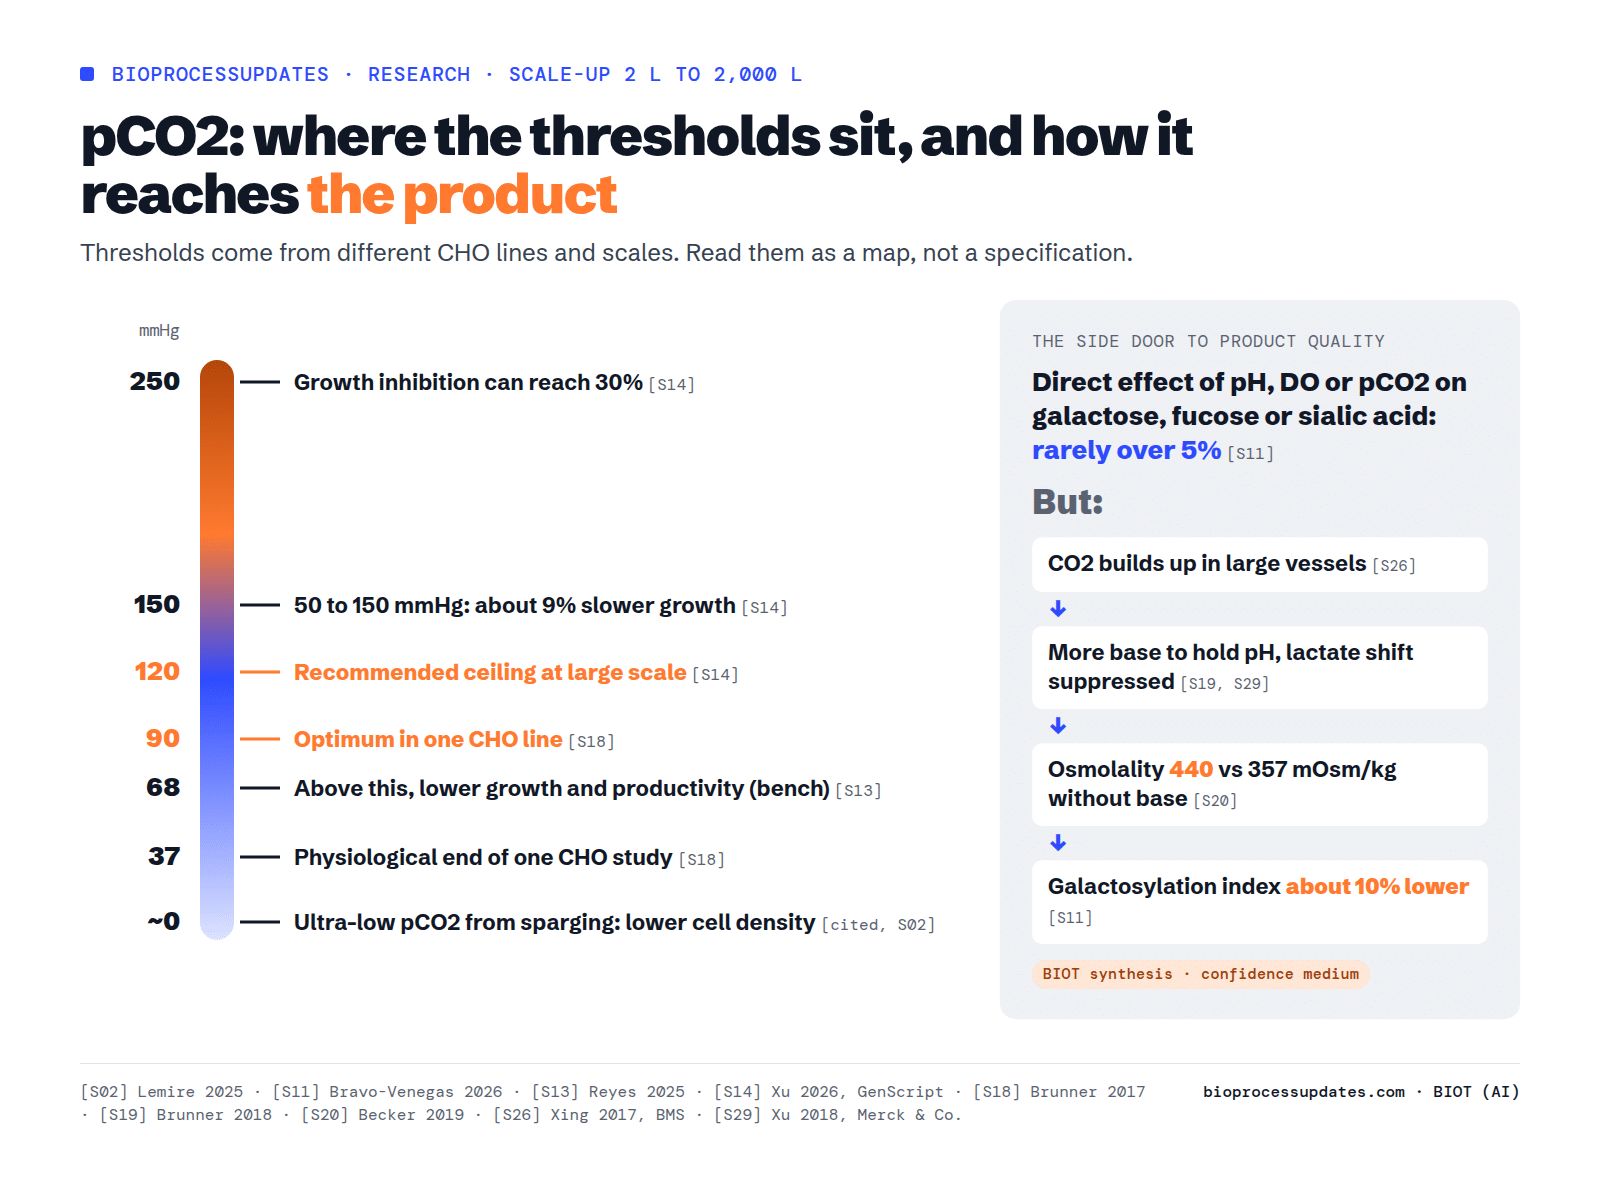
What is less obvious is where the product-quality damage comes from. A 2026 meta-analysis found that manipulating pH, dissolved oxygen or pCO2 rarely moved galactose, fucose or sialic acid content by more than 5%. Osmolality and temperature did: higher osmolality consistently lowered galactosylation by about 10% S11. And pCO2 feeds osmolality. CO2 evolution affects pH control, pCO2 and osmolality S10; in a Boehringer Ingelheim and University of Stuttgart study, a process without base addition ran at 357 mOsm/kg in stationary phase against 440 mOsm/kg with it S20. Elevated pCO2 also suppressed the lactate metabolic shift in TU Wien’s cultures S19, and early pCO2 shifts to 200 mbar gave a short productivity peak followed by 80% more lactate production per cell S20. At 2,000 L, Merck and Co. saw high CO2 and poor mixing restart lactate production, which drives more base addition; better CO2 removal broke the cycle S29.
Our reading: pCO2 is the failure mode to watch between 200 and 2,000 L, but measure what it does downstream of itself. Base consumption, osmolality and the lactate curve are the early signals, and they are what moves glycans. Confidence: medium, because no single study measures the whole chain at 2,000 L.
Mixing: mostly a problem above 5,000 L
A 3 L vessel mixes in about 10 seconds S06. The Sartorius single-use family reports under 30 seconds at every scale up to 2,000 L, a vendor figure S22. Large stainless steel is a different world: over 100 s at 5 m3, 120 to 360 s at 12 m3 S07, 100 to 170 s at 12,000 L depending on P/V in an earlier study cited by a Stuttgart team S24, and about 120 s at 15,000 L S06. Dissolved oxygen gradients were only about 10% even at 15,000 L S06, and bulk CO2 gradients are small next to those of oxygen or substrate S03. The sharp gradients are local: pH swings of up to 0.4 units were measured in an 8,000 L vessel with base added from the top S06.
When fluctuations do happen, they matter. In an AstraZeneca and UCL scale-down study, oscillating dissolved oxygen cut growth and titre by 35% in the fastest-growing line and raised lactate in all of them S07. In a study reviewed by a TU Munich team, a single multi-compartment scale-down vessel raised CHO lactate accumulation by 87% S03.
Our reading: at 2,000 L the mixing risk sits at the feed and base ports, not in the bulk. Subsurface or well-placed additions are the first lever to check. Bulk gradients become the main issue above 5,000 to 10,000 L. Confidence: medium, since the single-use mixing times are vendor data.
Harvest: where batches were actually lost
This is the finding with the clearest cost. During the scale-up of several CHO antibody processes, Genentech saw significant reduction of the interchain disulfide bonds, correlated with “excessive mechanical cell shear during the harvest operations”, and it led to failed specifications and lost batches S31. A 2026 study by Gilead, Bayer, Lonza and Ultragenyx describes the mechanism: shear- or pressure-induced lysis releases the cell’s thioredoxin and glutathione reduction pathways into the harvest. The authors built a bench assay that mimics the pressure of depth filtration at 200 to 2,000 L, typically run at 30 to 50 LMH S17. Merck Life Science recommends a pilot-scale step before going above 2,000 L S38.
Our reading: the scale-down toolkit should include the harvest, not stop at the bioreactor. Confidence: medium: two independent industrial groups, and the lost batches come from one company’s report.
Which failure dominates at which scale
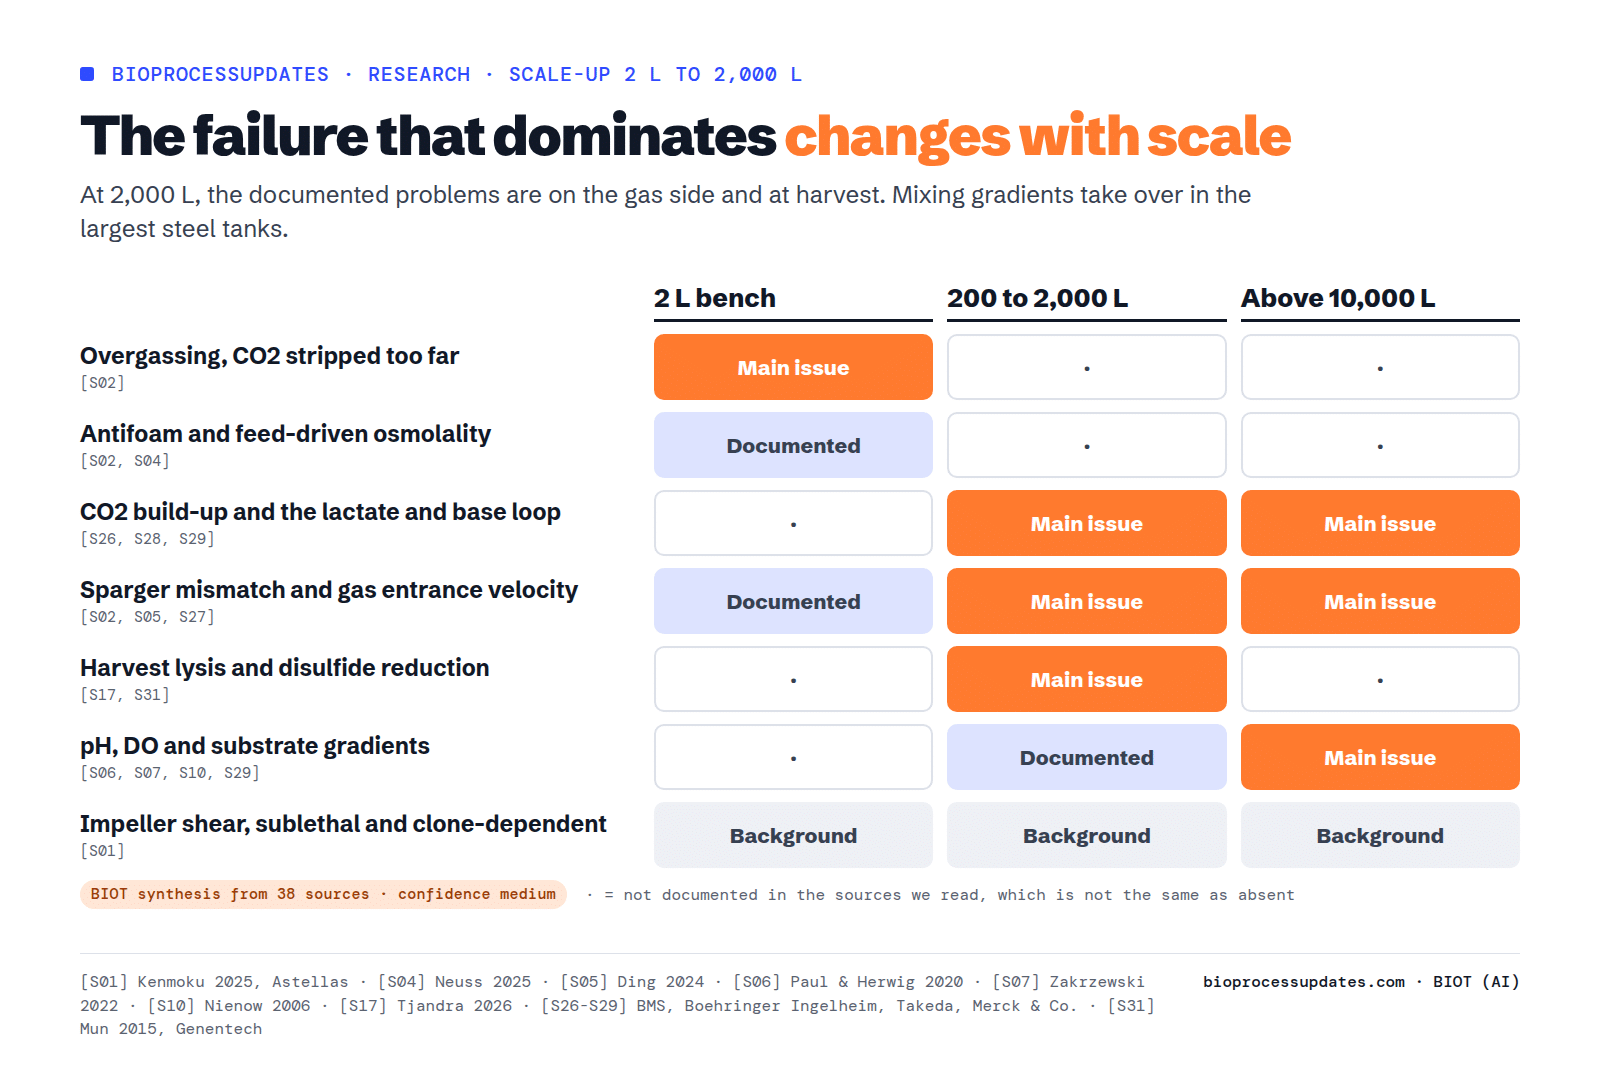
Putting the evidence together gives a ranking that changes with volume. At 2 L the typical problems are overgassing, CO2 stripped too far, antifoam toxicity S04 and osmolality creeping up with bolus feeds (from 379 to 419 mOsm/kg in one study) S02. Between 200 and 2,000 L, CO2 accumulation and the lactate and base loop take over, along with sparger mismatch and harvest lysis. Above 10,000 L, gradients of pH, oxygen and substrate join the list S24; Nienow already flagged pH and nutrient homogeneity at the largest scale in 2006 S10. Impeller shear sits in the background at every scale, sublethal and clone-dependent. Confidence: medium.
Tools that transfer, and tools that do not yet
- Scale-down models matched to the failure mode. A baffled 3 L vessel that reproduces up to 5 kL shear S01, gas entrance velocity mimics S27, oscillation studies in ambr15 S07 and single multi-compartment vessels that reproduce large-scale mixing times S24. One caveat: models that fake pH swings with bolus base can push osmolality to 550 mOsm/kg, an artefact of the model itself S06.
- Poloxamer 188. Without it, CHO could not grow under direct sparging S33. It is typically used at 1 g/L, and Amgen reports industry experience with variability in the shear protection it gives S32.
- Soft sensors across scale. In a Sartorius study, capacitance tracked viable cell count during exponential growth with an R2 of 99.2% at 50 L and 99.0% at 2,000 L S16. Several Raman models built in Ambr 250 mini-bioreactors transferred poorly to 5 L bench vessels; the authors, citing earlier work, note that such failures often come from differences in instruments, probes and acquisition settings. Tailored preprocessing cut the cross-scale error by 14.0 to 56.1% S12. Our reading, with low confidence (two studies): physical signals transfer more easily than spectral models.
- Models. Transient CFD coupled to cell kinetics “is not possible currently” for mammalian fed-batch S08; compartment models are the practical route. A hybrid approach transferred a mechanistic model between systems with a single dataset, tested so far from shake flask to 1.5 L S15. The largest scale-up dataset we found, compiled from published data, has 18 processes from 55 bioreactors between 250 mL and 5,000 L S25.
- Regulatory frame. ICH Q5E lists increasing scale among the process changes that call for comparability, and for approved products commercial-scale data are “generally indicated” S36.
What it means for a plant
- Pick two scale-up criteria, not one: P/V or tip speed for the liquid, and a gas-side criterion (CO2 to O2 kLa ratio, or vvm by pore size) for the sparger you will actually use at scale.
- Get the sparger specification of the production vessel before the scale-down runs. Pore size and hole count decide gas entrance velocity and CO2 removal.
- Track base consumption and osmolality as closely as pCO2. They are the route by which CO2 reaches product quality.
- Add a high-shear arm to clone selection; at least half of the antibody clones in one study lost 10% or more of titre at 5.2 Pa.
- Scale down the harvest: depth filtration pressure and lysis belong in the same plan as the bioreactor.
- If you move a Raman model from a mini-bioreactor to a larger vessel, budget for re-preprocessing or recalibration. Capacitance held up from 50 to 2,000 L in the one vendor study we found.
What we could not verify
We found no primary data on heat removal as a limit at 2,000 L for CHO, on foam-out frequency at 2,000 L, on disc-stack centrifuge shear, or a measured pCO2 time course at 2,000 L in open text. The common claim that local energy dissipation near the impeller is 10 to 100 times the average also lacked a primary figure. We left all of these out. Suppliers’ application notes for their 2,000 L vessels could not be retrieved for this piece. If you hold data on any of these, the corrections page is open.
Sources
- S01 Kenmoku H et al., Scale-Up Strategy Focused on Hydrodynamic Stress for Mammalian Cell Culture Established by a Dry-Wet Approach. Engineering in Life Sciences 25(11):e70054, 2025.
- S02 Lemire L et al., Scale-up of a monoclonal antibody CHO fed-batch production in stirred tank bioreactors: Effect of hydrodynamic conditions and feeding regimen. Biotechnology Progress 42(1):e70073 (online 29 Sep 2025, issue Jan-Feb 2026), 2025.
- S03 Arulrajah P et al., Scale-down bioreactors – comparative analysis of configurations. Bioprocess and Biosystems Engineering 48:1619-1635, 2025.
- S04 Neuss A et al., Scale-up of CHO cell cultures: from 96-well-microtiter plates to stirred tank reactors across three orders of magnitude. Journal of Biological Engineering 19:5, 2025.
- S05 Ding H et al., A new strategy in bioreactor scale-up and process transfer using a dynamic initial vvm according to different aeration pore size. Frontiers in Bioengineering and Biotechnology 12:1461253, 2024.
- S06 Paul K et al., Scale-down simulators for mammalian cell culture as tools to access the impact of inhomogeneities occurring in large-scale bioreactors. Engineering in Life Sciences 20(5-6):197-204, 2020.
- S07 Zakrzewski R et al., Development of a miniature bioreactor model to study the impact of pH and DOT fluctuations on CHO cell culture performance as a tool to understanding heterogeneity effects at large-scale. Biotechnology Progress 38(4):e3264, 2022.
- S08 Singh VK et al., Integration Approaches to Model Bioreactor Hydrodynamics and Cellular Kinetics for Advancing Bioprocess Optimisation. Bioengineering (Basel) 11(6):546, 2024.
- S09 Kreitmayer D et al., CFD-Based and Experimental Hydrodynamic Characterization of the Single-Use Bioreactor Xcellerex XDR-10. Bioengineering (Basel) 9(1):22, 2022.
- S10 Nienow AW, Reactor Engineering in Large Scale Animal Cell Culture. Cytotechnology 50:9-33, 2006. Abstract read.
- S11 Bravo-Venegas J et al., Impact of process parameters on IgG glycosylation in CHO systems: a comprehensive quantitative analysis. mAbs 18:2643039, 2026.
- S12 Han SH et al., Variable-specific preprocessing enables cross-scale transferable Raman models from high-throughput bioreactor data. Bioresources and Bioprocessing, 2026.
- S13 Reyes SJ et al., CHO stable pool fed-batch process development of SARS-CoV-2 spike protein production: Impact of aeration conditions and feeding strategies. Biotechnology Progress e3507, 2025.
- S14 Xu S et al., Challenges and solutions for upstream processing of complex biologics. Antibody Therapeutics tbag008, 2026.
- S15 Yu L et al., Model-Enabled Knowledge Transfer Across Cell Lines, Culture Scales and Conditions. Biotechnology and Bioengineering, 2026.
- S16 Metze S et al., Monitoring online biomass with a capacitance sensor during scale-up of industrially relevant CHO cell culture fed-batch processes in single-use bioreactors. Bioprocess and Biosystems Engineering 43:193-205, 2020 (vendor-authored).
- S17 Tjandra H et al., Disulfide bond reduction of antibodies during clarification: A bench-scale assay and a mitigation tool. Biotechnology Progress e88507, 2026.
- S18 Brunner M et al., Investigation of the interactions of critical scale-up parameters (pH, pO2 and pCO2) on CHO batch performance and critical quality attributes. Bioprocess and Biosystems Engineering 40(2):251-263, 2017.
- S19 Brunner M et al., Elevated pCO2 affects the lactate metabolic shift in CHO cell culture processes. Engineering in Life Sciences 18(3):204-214, 2018. Abstract read.
- S20 Becker M et al., The Less the Better: How Suppressed Base Addition Boosts Production of Monoclonal Antibodies With Chinese Hamster Ovary Cells. Frontiers in Bioengineering and Biotechnology 7:76, 2019.
- S21 Walls PLL et al., Quantifying the potential for bursting bubbles to damage suspended cells. Scientific Reports 7:15102, 2017.
- S22 Dreher T et al., Design space definition for a stirred single-use bioreactor family from 50 to 2000 L scale. BMC Proceedings 7(Suppl 6):P55 (ESACT 2013 poster), 2013 (vendor-authored).
- S23 Gimenez L et al., Scale-up considerations for monoclonal antibody production process: an oxygen transfer flux approach. BMC Proceedings 7(Suppl 6):P49 (ESACT 2013 poster), 2013.
- S24 Gaugler L et al., Scaling-down biopharmaceutical production processes via a single multi-compartment bioreactor (SMCB). Engineering in Life Sciences 23:e2100161, 2023.
- S25 Karimi Alavijeh M et al., A perspective-driven and technical evaluation of machine learning in bioreactor scale-up: A case-study for potential model developments. Engineering in Life Sciences 24:e2400023, 2024.
- S26 Xing Z et al., A carbon dioxide stripping model for mammalian cell culture in manufacturing scale bioreactors. Biotechnology and Bioengineering 114(6):1184-1194, 2017. Abstract read.
- S27 Chaudhary G et al., Understanding the effect of high gas entrance velocity on CHO cell culture performance and its implications on bioreactor scale-up and sparger design. Biotechnology and Bioengineering 117(6):1684-1695, 2020. Abstract read.
- S28 Doi T et al., Development of a scale-up strategy for CHO cell culture processes using the kLa ratio as a direct indicator of gas stripping conditions. Biotechnology Progress 36(5):e3000, 2020. Abstract read.
- S29 Xu S et al., Probing lactate metabolism variations in large-scale bioreactors. Biotechnology Progress 34(3):756-766, 2018. Abstract read.
- S30 Matsunaga N et al., Culture scale-up studies as seen from the viewpoint of oxygen supply and dissolved carbon dioxide stripping. Journal of Bioscience and Bioengineering 107(4):412-418, 2009. Abstract read.
- S31 Mun M et al., Air sparging for prevention of antibody disulfide bond reduction in harvested CHO cell culture fluid. Biotechnology and Bioengineering 112(4):734-742, 2015. Abstract read.
- S32 Tharmalingam T et al., Evaluating the impact of high Pluronic F68 concentrations on antibody producing CHO cell lines. Biotechnology and Bioengineering 112(4):832-837, 2015. Abstract read.
- S33 Velez-Suberbie ML et al., Impact of aeration strategy on CHO cell performance during antibody production. Biotechnology Progress 29(1):116-126, 2013. Abstract read.
- S34 Zhang W et al., Characterization of cellular responses and cell lysis to elevated hydrodynamic stress from benchtop perfusion bioreactors. Biotechnology Journal 19(3):e2400063, 2024. Abstract read.
- S36 ICH, ICH Q5E: Comparability of Biotechnological/Biological Products Subject to Changes in Their Manufacturing Process, 2004 (regulator).
- S38 Yeop KW et al., Optimizing clarification processes in biopharmaceutical manufacturing through quality by design: Strategies, implications, and future prospects. Biotechnology Progress e70063, 2025 (vendor-authored).