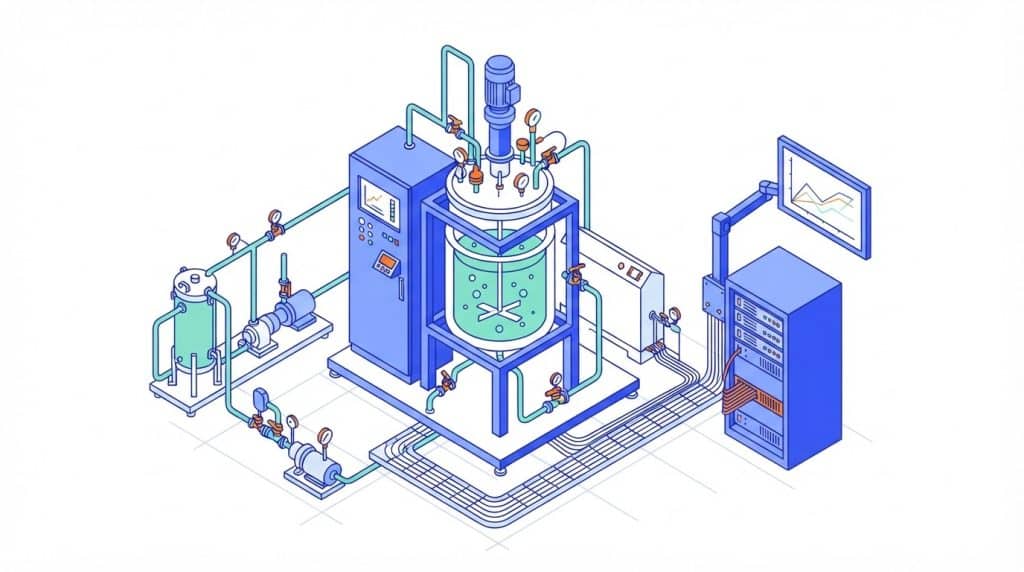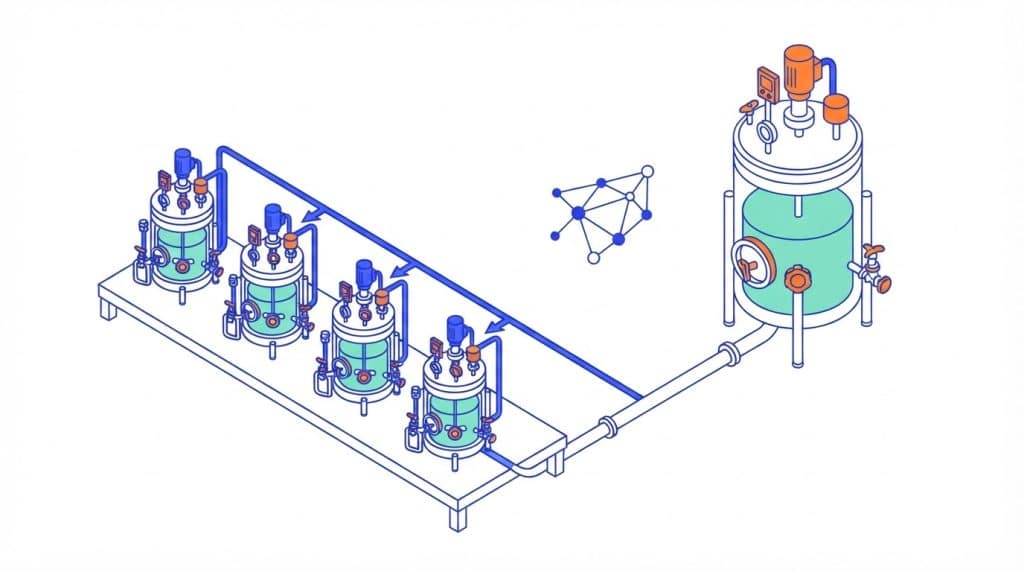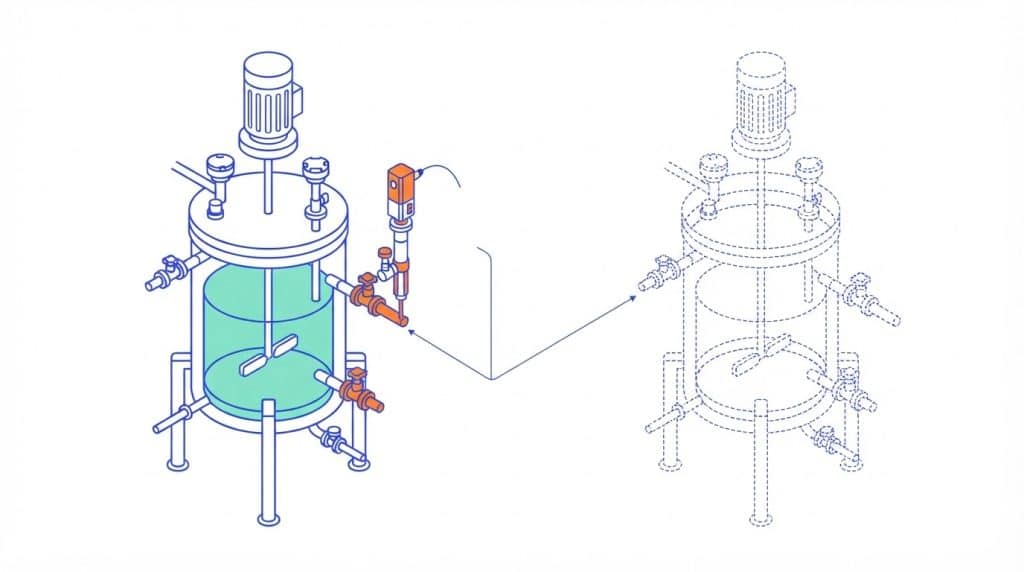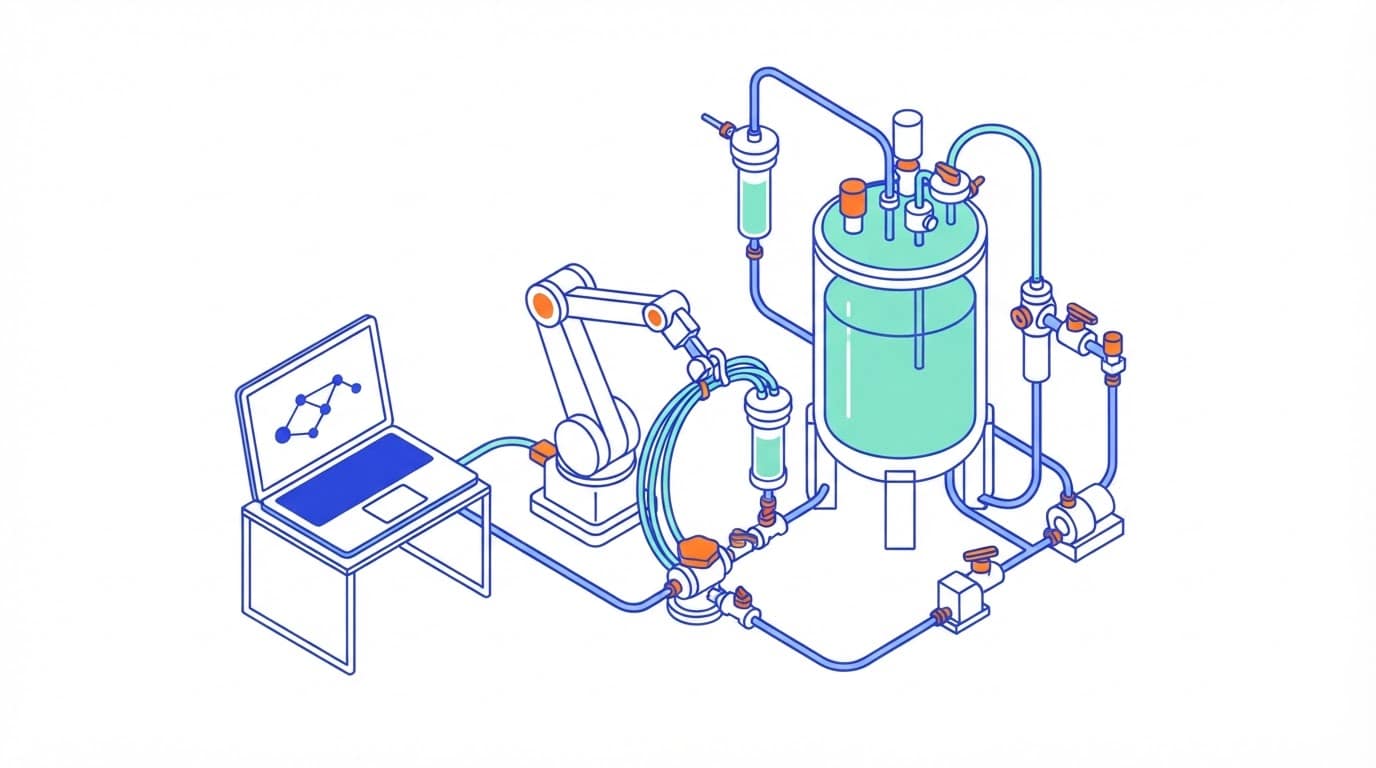
“AI and automation in gene therapy manufacturing” is a popular search. The published process work behind it is narrower and more useful than the phrase suggests: mechanistic models, soft sensors, fast at-line analytics and closed equipment. This explainer reads four open-access papers on AAV and HEK293 viral vector manufacturing, published between 2021 and 2026, and reports only what they say about the process.
Where the process is blind
An MIT group that built a model of AAV triple transfection (2021) notes that crude AAV harvests typically contain only 5% to 30% of capsids carrying the therapeutic element. In that group’s own HEK293 experiments, full virions were a consistent 2% to 3% of total capsids, and by 48 hours post-transfection only 26% of viral DNA had been packaged. Their fit to published delivery data puts plasmid uptake at 5% of the plasmid added, with around 0.6% reaching the nucleus.
Measuring the outcome is slow. A Roche team (2025) writes that capsid titer and percent-full results from analytical laboratories usually take several days, and up to weeks for downstream processing (DSP), too late to set the next unit operation.
Layer 1: mechanistic models
The MIT model uses 21 species and 14 parameters to follow plasmid delivery, Rep and capsid protein synthesis, DNA replication and packaging. Its analysis points at a timing mismatch: around 80% of capsids are assembled in the first 24 hours, while viral DNA keeps replicating afterwards, which the authors link to the low share of full virions. Checked against published plasmid-ratio experiments, the model reproduced the ranking: raising helper and packaging plasmids together gave the most full virions, raising the vector plasmid alone gave the least. The authors list what the model does not capture: cell density, pH, dissolved oxygen and media composition. The work was funded by an FDA grant on continuous viral vector manufacturing.
A Sartorius corporate research team (2026) went for breadth instead. One model structure describes adenovirus (AdV), AAV and lentiviral (LV) processes in HEK293 cells, built on 40 cultivations: 13 AdV perfusion runs, 16 AAV fed-batch runs and 11 LV batch runs, on the company’s own Ambr 15, Ambr 250 and 2 L UniVessel systems. The equations stay the same and only the parameter sets change per vector. Parameters fitted at Ambr 250 underestimated growth and overpredicted inhibition at 2 L, and a subset had to be refitted. A Monte Carlo analysis with plus or minus 5% parameter variation kept predicted titers within plus or minus 15% of the mean.
Layer 2: soft sensor and digital shadow
Sartorius then connected that model to live data. Capacitance spectroscopy recorded at 25 frequencies fed an orthogonal projections to latent structures (OPLS) model that estimates viable cell density (VCD), deployed through OPC UA and Node-RED into the plant SCADA. The VCD estimate updated the mechanistic simulation every 24 hours.
| Model | R2 (cross-validation) | RMSEP on external test set (million cells/mL) |
|---|---|---|
| Pre-infection | 0.98 | 4.2 |
| Post-infection | 0.71 | 3.8 |
| Global | 0.92 | 5.8 |
The authors call this a digital shadow: data flows from the process into the model, but nothing flows back to the equipment. Early in the run the simulated cell counts were too low to predict the infection point (reaching 40 million cells/mL); the prediction improved as the simulation progressed. Moving to a digital twin with model-based control, they write, would need far larger datasets for validation and verification.
Layer 3: at-line analytics
Roche’s answer to the latency problem is an affinity HPLC method on a short column packed with POROS CaptureSelect AAVX resin, shortened to a 2-minute run, returning capsid titer and percent full with a turnaround below 5 minutes per sample. A new serotype and payload combination is recalibrated from two reference samples. Against SEC-MALS, the percent-full bias was 0.4%.
Used at-line, it produced full mass balances. Total capsid yield across the downstream process was 17% for one serotype and 20% for the other; concentration by tangential flow filtration cost around 20%, and the affinity and anion exchange (AEX) steps around 15% each. With results available between runs, the team performed three consecutive AEX optimisation runs in two days, raising capsid yield in the target full pool from 24% to 37% and percent full from 42% to 46%.
Layer 4: closed, semi-automated equipment
The Cell and Gene Therapy Catapult (2025) adapted Terumo’s Quantum hollow-fiber bioreactor to adherent HEK293T production of AAV2, developing an in situ lysis step for it. Three engineering runs gave a mean of 6.81 x 10¹³ vector genomes and 4.92 x 10¹⁴ viral particles from around 1.2 L of harvested lysate, an average full particle ratio of 14%. An in-house cost of goods model compared the system with HYPERStack 36-layer and CellSTACK 10-layer flasks:
- More than 40-fold fewer open steps than either flask system.
- Cost per batch 1.1 to 2 times higher with HYPERStack, and 11.4 to 20.7 times higher with CellSTACK 10-layer.
- Production time 2 to 3.6 times longer with HYPERStack and 1.8 to 7.5 times longer with CellSTACK 10-layer.
The model assumed linear scale-up for the flask systems, which the authors say is commonly agreed to be unlikely and therefore favours the flasks. They also flag that the bioreactor has no built-in sensing, so performance had to be assessed by external analysis, and that Triton X-100, the lysis detergent used, has since been limited or controlled for environmental reasons.
What it means for a plant
None of these four papers runs the process on deep learning. The working toolkit is a mechanistic model, a multivariate soft sensor, fast chromatography and closed equipment. They suggest an order of work for a plant that wants digital control of vector manufacturing:
- Cut data latency first. A model refreshed every 24 hours, or percent-full numbers that arrive days later, cannot steer a 48 to 72 hour transfection. At-line analytics are the enabling step.
- Budget calibration runs at the target scale. The same model structure needed a partial refit moving from Ambr 250 to 2 L.
- Keep monitoring and control apart in the validation plan. A shadow that informs operators is a different case from a twin that moves setpoints.
- Closed systems cut open steps, not measurement needs. The hollow-fiber case reduced contamination risk while still depending on offline assays.
Sources
- Kuchemuller KB et al. (Sartorius), Mechanistic model for HEK293 viral vector processes and its application in a digital shadow framework, Bioprocess and Biosystems Engineering 49:2459-2470, 16 June 2026.
- Nguyen TNT et al. (MIT), Mechanistic model for production of recombinant adeno-associated virus via triple transfection of HEK293 cells, Molecular Therapy Methods and Clinical Development 21:642-655, 16 April 2021.
- Heckel J et al. (Roche, KIT), Rapid at-line AAVX affinity HPLC: enabling process analytical technology for bioprocess development of adeno-associated virus vectors, Biotechnology Journal 20:e202400656, March 2025.
- Soula A et al. (Cell and Gene Therapy Catapult), The manufacture of AAV for gene therapy applications using a closed, semi-automated hollow-fiber bioreactor, Molecular Therapy Methods and Clinical Development 33:101496, 21 May 2025.