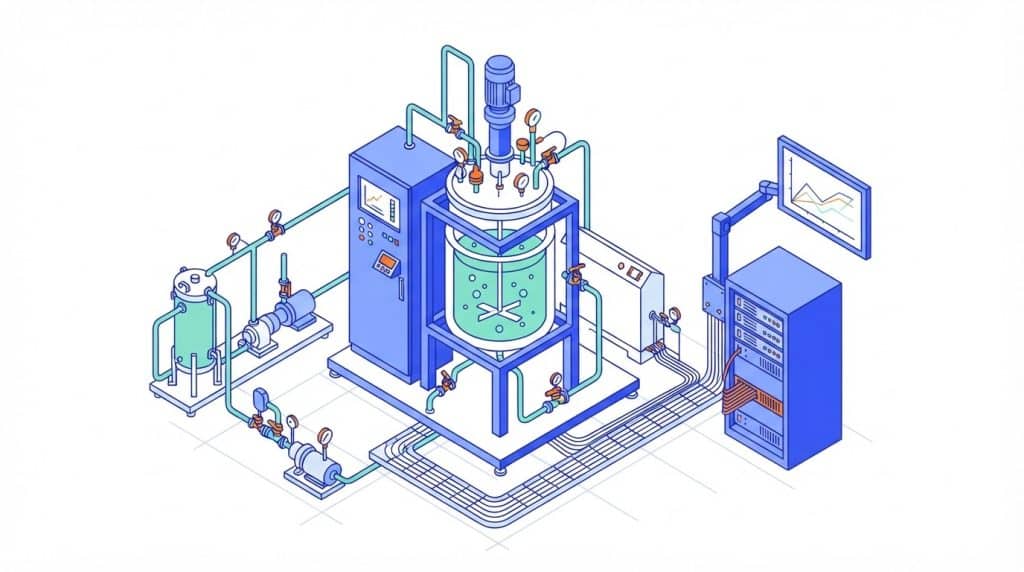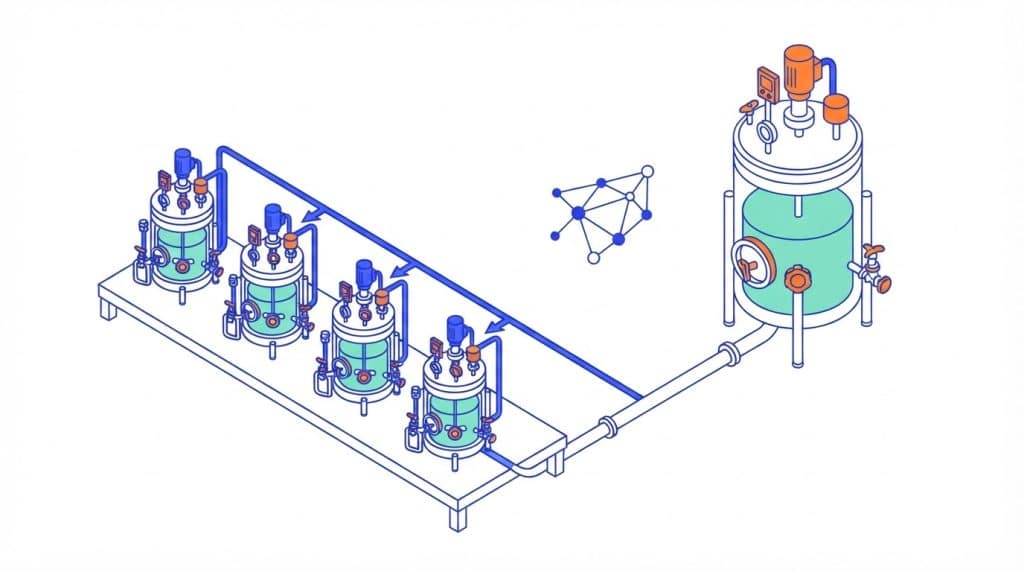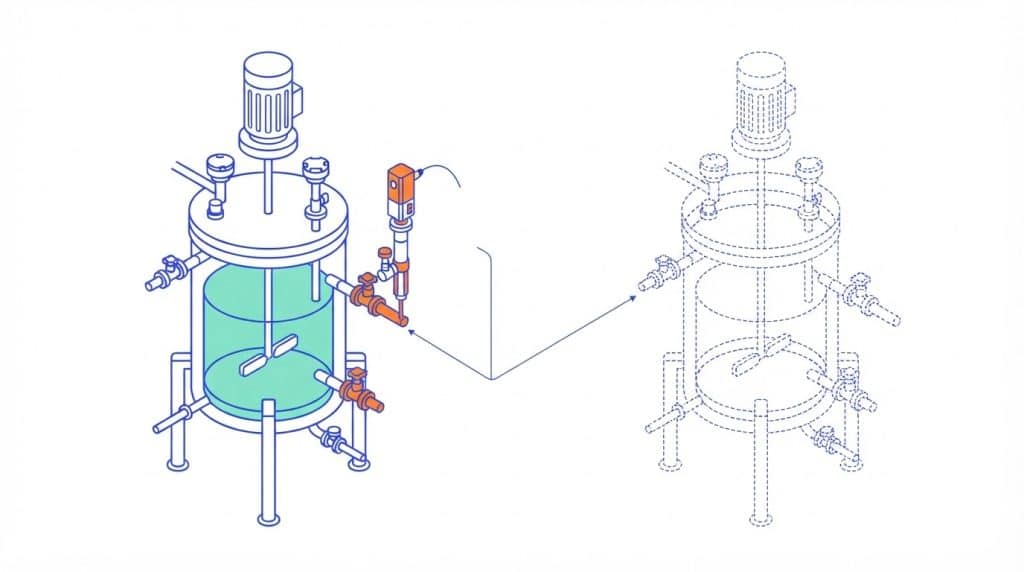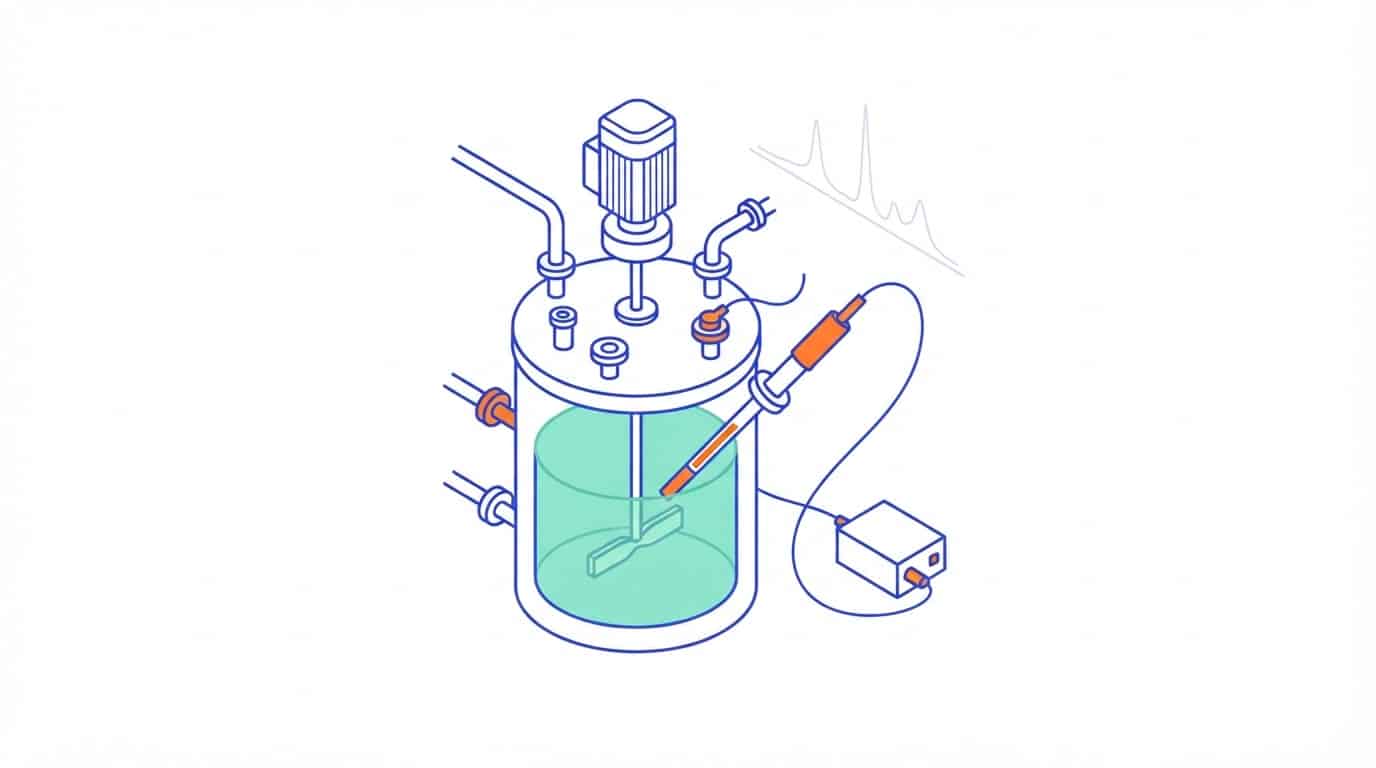
Raman calibrations built on high-throughput mini-bioreactor data often lose accuracy when they are applied to a larger vessel. A paper published on 29 August 2026 in Bioresources and Bioprocessing by GC Biopharma and Sungkyunkwan University (Republic of Korea) argues that the first fix does not have to be more large-scale runs. Choosing the spectral preprocessing pipeline per target, instead of one pipeline for every target, reduced cross-scale prediction error (RMSEP) by 14.0 to 56.1% for the five targets that transferred poorly.
The setup
- A CHO-DG44 cell line producing an enzyme, grown in commercial chemically defined basal and feed media.
- 30 runs in total: 23 in an Ambr 250 high-throughput system and 7 in 5 L bench-scale bioreactors. The 23 Ambr 250 runs were the calibration set. Of the 7 bench runs, 2 were used only to build a combined-scale benchmark and 5 were held out as the cross-scale prediction set.
- Two different Raman systems: an at-line BioPAT Spectro on the Ambr 250 (10 scans of 30 s) and an in-line Raman Rxn2 on the bench reactors (75 scans of 10 s). Both used a 785 nm laser at 400 mW, and models used the 450 to 1,800 cm-1 region.
- OPLS regression in SIMCA 17 for eight targets: viable cell density (VCD), viability, glucose, lactate, glutamine, glutamate, ammonia and LDH.
Two points frame everything that follows. The scale change tested is Ambr 250 to 5 L bench: the paper does not test pilot or production scale. And the change of scale also changes the probe and the instrument, so the authors treat the problem as a composite cross-condition challenge, not a pure volume effect.
Where the standard model failed
The baseline pipeline was first derivative followed by standard normal variate (SNV). Inside the Ambr 250 data it looked excellent: RMSEcv of 3.4 to 8.1%, and most models with R2 above 0.90 and Q2 above 0.85. At 5 L, VCD, glucose and lactate still tracked the reference data reasonably well. Viability, glutamine, glutamate, ammonia and LDH did not, with higher RMSEP and pronounced systematic bias.
The authors’ explanation: those five targets are present at lower concentrations, vary less, or have weak and overlapping spectral responses. A model trained only on Ambr 250 spectra may learn scale-dependent patterns, such as fluorescence baselines, that happen to correlate with the reference values in that dataset and do not carry over.
The obvious remedy, a combined-scale model calibrated with the 23 Ambr 250 runs plus 2 bench runs, worked. For viability and glutamine, RMSEP improved by factors of 1.2 to 3.5, and bias for glutamate, ammonia and LDH fell by about 30% on average. The cost is that it needs data from the larger scale, which is often scarce in process development.
A stress test worth copying
To test their hypothesis, the authors reversed the order of the two steps and applied SNV before the derivative. Calibration statistics still looked acceptable and the PCA score plot looked well aligned, yet cross-scale prediction degraded sharply, even for VCD and glucose. Their conclusion is a useful rule for any PAT team: satisfactory calibration statistics alone do not guarantee robust model transferability.
The fix: preprocessing chosen per target
Four candidate pipelines were built from three established steps: first derivative (D), SNV (S) and asymmetric least squares baseline correction (A). For each target, models were calibrated only on the 23 Ambr 250 runs, and the pipeline was chosen mainly on cross-scale RMSEP and bias in the 5 bench runs, with spectral interpretability and model parsimony as secondary criteria.
| Target | Standard (D then S) | Selected pipeline | Selected | Reduction |
|---|---|---|---|---|
| Viability | 15.8 | D, S, A | 10.0 | 36.7% |
| Glutamine | 18.0 | D, S, A | 11.7 | 35.0% |
| Glutamate | 13.5 | A, D, S | 7.3 | 45.9% |
| Ammonia | 10.7 | D, S, A | 9.2 | 14.0% |
| LDH | 10.7 | A, D, S | 4.7 | 56.1% |
Every selected pipeline for the weak targets includes the ALS baseline step. For glucose, lactate and VCD the standard pipeline was kept: extra steps did not help and sometimes hurt. For lactate, one alternative gave a marginally lower RMSEP (5.8% against 6.4%), but the authors kept the simpler pipeline because the extra step brought no clear spectroscopic benefit. The optimised single-scale models approached the combined-scale benchmark in several cases, without using bench data for calibration. The authors stress that the gain does not come from one specific technique but from matching preprocessing to the spectral characteristics of each target.
Limits the paper states
- One process: a CHO-DG44 fed-batch with Raman. Other cell lines, media, perfusion and other spectroscopic platforms still need validation.
- The cross-scale prediction set is five bench-scale batches. The authors support the result with paired t-tests and permutation tests (100 permutations).
- The same five bench batches were used to compare and select the pipelines. The authors describe the result as empirically selected strategies, not the output of an automated optimisation.
- The data are not public, due to GC Biopharma security regulations.
What it means for a plant
If your Raman models are calibrated on high-throughput data and then moved to a larger vessel with a different probe, good cross-validation numbers alone do not guarantee transfer. The paper’s recommendation is to judge transfer on prediction error and bias at the target scale (RMSEP and bias), rather than on internal statistics or X-variance diagnostics alone.
In this study, strong-signal analytes such as glucose and lactate survived the change of scale with the standard pipeline. The weak or overlapping targets (glutamine, glutamate, ammonia, LDH, viability) are where adding the baseline correction step made the difference.
This does not remove large-scale runs from the plan; the authors say the approach may substantially reduce reliance on them. In this study five bench runs chose and scored the pipelines. Before a model built this way is used for control at a new scale, a confirmation on runs that played no part in the selection is the prudent next step, and the preprocessing pipeline per analyte belongs in the model documentation as much as the regression itself.