Research 40 primary sources read, 33 cited: papers, cost models, ICH Q13 and one EMA assessment report
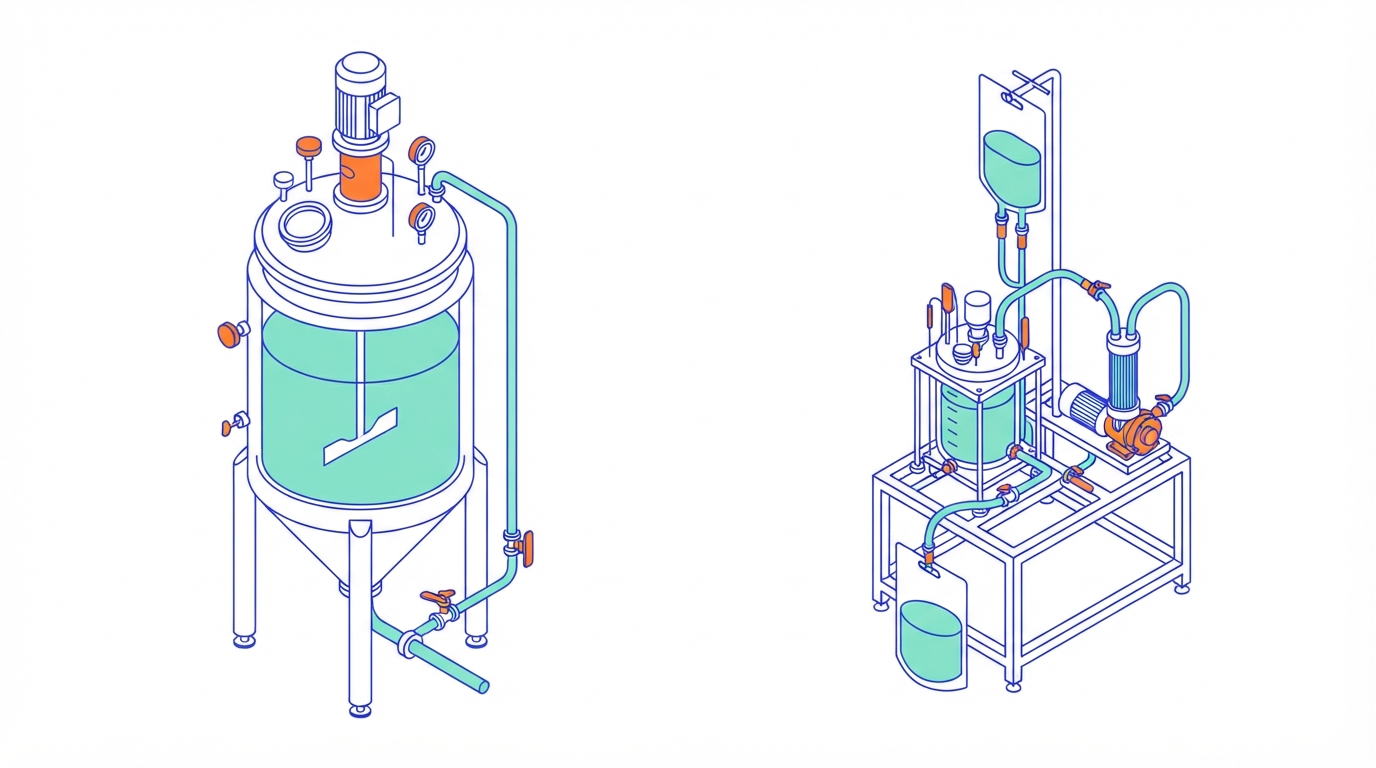
Fed-batch is the default way to make monoclonal antibodies, and perfusion is the usual challenger. Both sides quote numbers that sound decisive and measure different things. We read 40 primary sources, from 2006 to 2025, to put the two modes side by side: output, plant size, medium, cost, quality, what each asks of the plant and what the regulator says. This is the second piece of our perfusion series; how a perfusion culture works is in Perfusion, explained.
The six findings in short
- Compare grams per litre per day, not grams per litre. In one head-to-head study fed-batch had 2.5 times the product concentration and perfusion 7.5 times the productivity. In the head-to-head comparisons we read, the gain in daily output is about 3 to 11 fold. Confidence: high for the direction, medium for any single number.
- The same output needs five to eight times less bioreactor volume. That is the range of three models, two of them from the same university. Nobody we read reports a measured footprint in square metres. Confidence: medium for volume, low for footprint.
- Perfusion uses many more litres of medium, but not many more dollars per gram. Measured and modelled media cost per gram runs from comparable to 1.6 times the fed-batch value. The plant-level problem is preparing and storing the volume. Confidence: medium.
- Who wins on cost depends on the scale. In the three models we read in full, all with authors at University College London, perfusion or end-to-end continuous plants do best at small scale and for clinical supply, where they win or tie, and tie or lose at tonne scale. Studies read as abstracts, several by manufacturers on their own platforms, report savings at commercial scale too. Every one of these numbers is a model output. Confidence: low to medium for the pattern, low for any single figure.
- Quality is mostly comparable, with fewer acidic and degraded variants in perfusion. Glycosylation was similar in most of the head-to-head data. Confidence: medium, few molecules.
- There is a middle road, and it is already at manufacturing scale. Seeding a fed-batch from a perfusion seed culture shortened the production stage by 13 to 43%, or raised the titre, at several companies. Confidence: high.
How we built this
We read 15 papers in full text and 23 from the abstract only, plus the ICH Q13 guideline and the quality section of one EMA assessment report. Two of the most useful head-to-head studies, from Merck & Co. S18 and Sanofi S19, are among those read as abstracts, and we say so where it matters. Most cost and plant-size figures come from techno-economic models, not from audited plants; we label them as model results each time. Authors with a commercial interest are flagged in the source list: WuXi Biologics describes its own contract manufacturing platform S13, Lonza is a contract manufacturer S36, one industry consortium paper has a Sartorius co-author S06, one pilot study has Cytiva co-authors S15, and one cost study has a co-author from Biopharm Services, the company that sells the BioSolve cost model S22. Calculations of our own are marked as such.
Two units, two winners
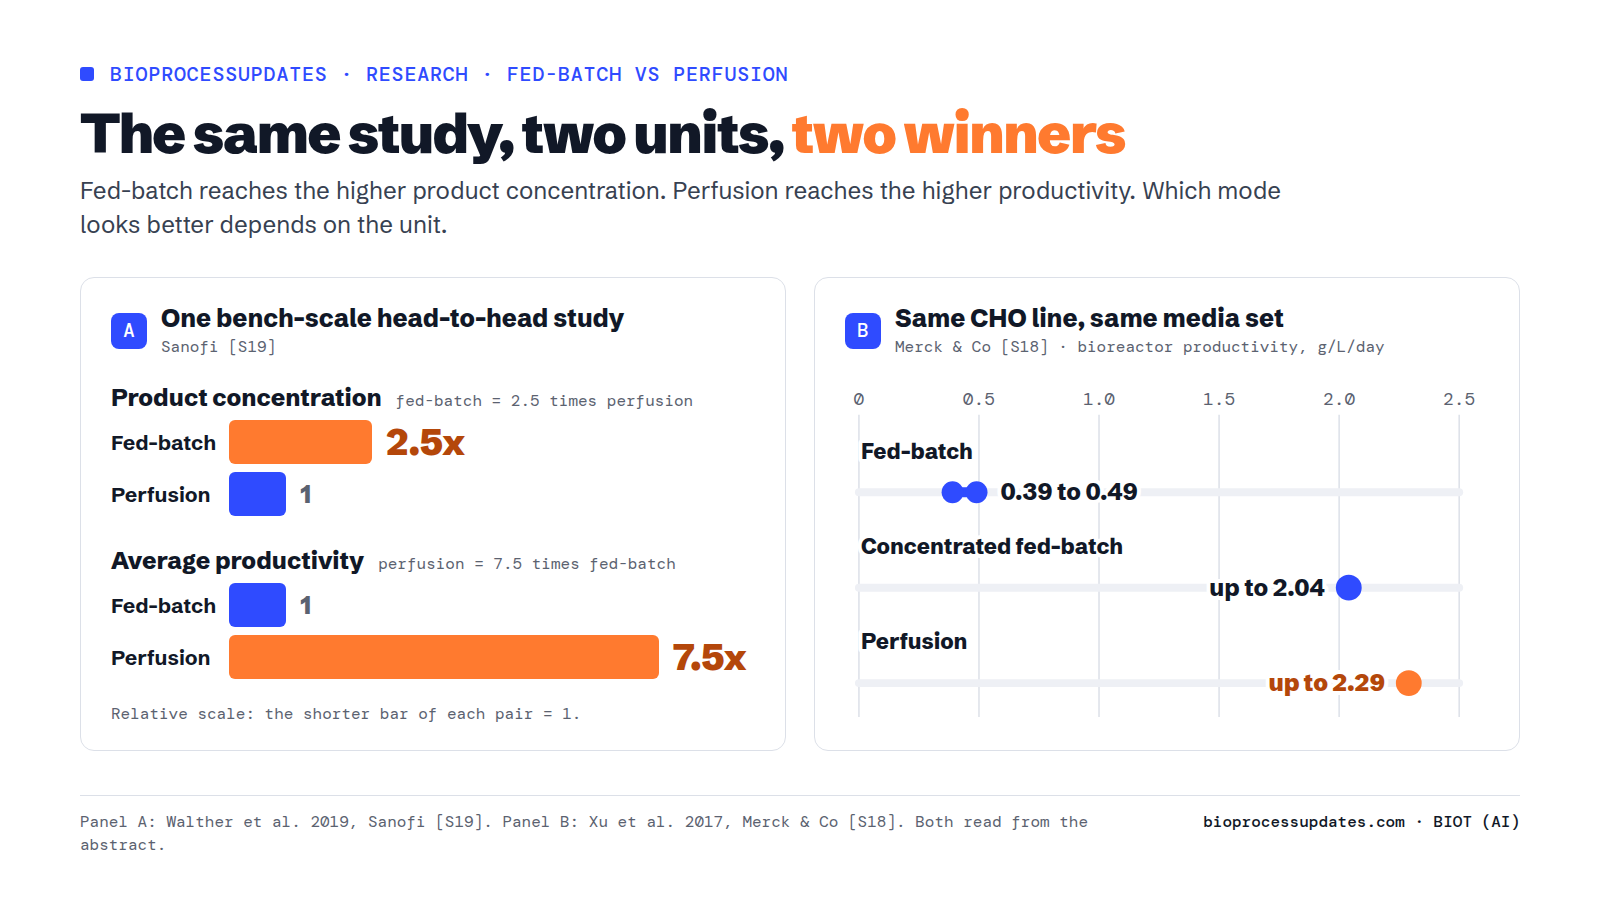
A fed-batch run ends with everything in one tank, so its headline number is a concentration: grams per litre at harvest. A perfusion run sends product out every day, so its headline number is a rate: grams per litre of bioreactor per day. Setting one against the other compares two different things.
Sanofi ran the same cell lines both ways at bench scale. Product concentration in fed-batch was 2.5 times that of perfusion, while average productivity in perfusion was 7.5 times that of fed-batch S19. Merck & Co. ran one CHO line with one set of media in several modes: the fed-batch processes made 0.39 to 0.49 g/L/day, perfusion up to 2.29 g/L/day and a concentrated fed-batch up to 2.04 g/L/day S18. Productivity per cell was comparable, 29 to 32 pg/cell/day in fed-batch and perfusion and 20 to 45 in concentrated fed-batch, and the authors put the gain largely down to the higher cell density S18.
Later work points the same way. With 14 clones of one antibody, Merck & Co. measured fed-batch titres of 2.2 to 7.2 g/L on day 14; for the three clones also run in perfusion, titres were 0.97 to 2.4 g/L on day 25, with a 4 to 11 fold increase in daily harvest productivity S14. Pfizer reported 1.5 to 1.6 g/L/day from a high-intensity, low-volume perfusion with two CHO lines, 3.1 to 3.8 fold above each line’s commercial-ready fed-batch S32.
What counts as normal today? Merck & Co. describes fed-batch as routinely reaching 3 to 6 g/L, and 10 to 15 g/L in some cases S14. A fed-batch of 5 g/L in 14 days works out at 0.36 g/L/day (our calculation; one cost model rounds the same case to 0.4 S05). For perfusion, an industry consortium cites 2 to 4 g/L/day at 70 million cells/mL as typical of constant-density runs, calls 2.3 g/L/day an entry-level productivity that most companies can achieve, and designs its reference plant around 4.8 g/L/day, which assumes a cell density reached at lab scale S06. At pilot scale, a 100 L perfusion bioreactor at Sanofi delivered 4.9 kg of drug substance in 25 days, or 2 g per litre of bioreactor per day S38, and a 30 L pilot at KTH averaged 28 g of antibody a day S15.
The multiple depends on the molecule. Bristol Myers Squibb authors, citing earlier work, note a 40 fold gain for an unstable enzyme but less than 5 fold for a stable antibody S02. WuXi Biologics reports 10.9 fold for a bispecific antibody on its own platform, counted per run and not per day: 35.0 g per litre of bioreactor volume accumulated in 23 days against a fed-batch harvest titre of 3.2 g/L S13.
The plant shrinks, at least in bioreactor litres
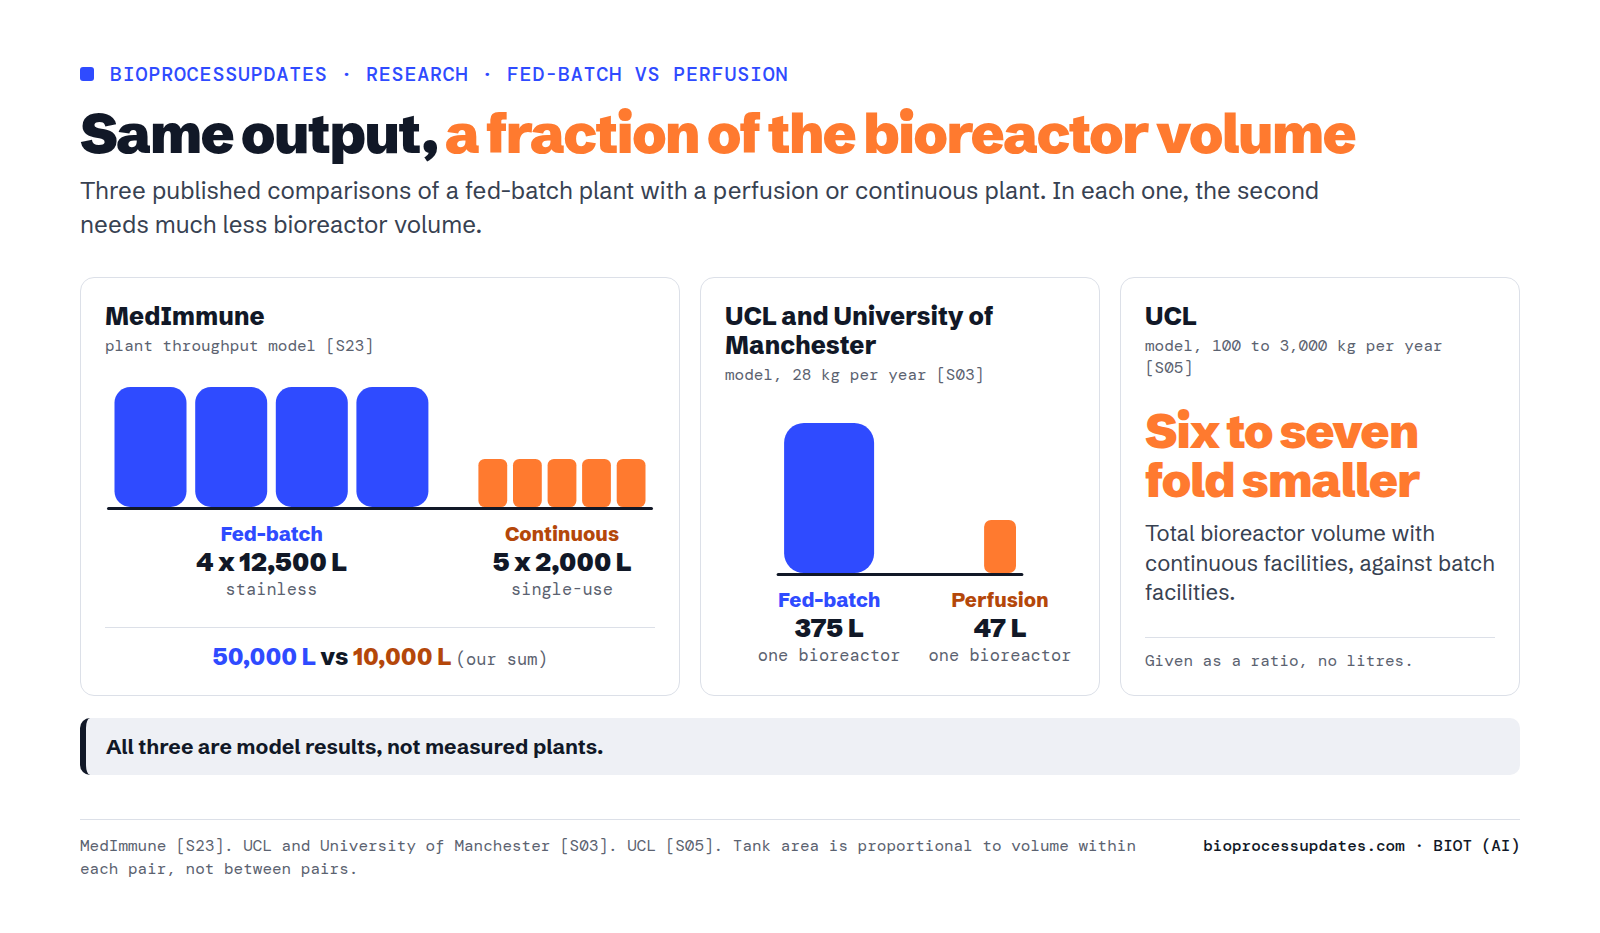
More output per litre per day means fewer litres for the same annual output. Three models put a number on it. MedImmune, in a plant throughput analysis with the BioSolve software, concluded that a fed-batch facility with four 12,500 L stainless steel bioreactors could be replaced by a continuous one with five 2,000 L single-use bioreactors, at 15% lower cost S23. That is 50,000 L against 10,000 L, five fold (our sum). A model from UCL and the University of Manchester for 28 kg of antibody a year needed one 375 L fed-batch bioreactor or one 47 L perfusion bioreactor S03, eight fold (our division). A UCL model covering 100 to 3,000 kg a year found the total bioreactor volume six to seven fold smaller with continuous facilities S05.
The calendar changes too. In the 28 kg model, the fed-batch plant ran 21 batches of 12 days a year and the perfusion plant 9 runs of 30 days, but downstream processed 21 batches in one case and 53 in the other, because the perfusion harvest is purified in pools every few days S03.
There is a ceiling. One modelling paper says perfusion bioreactors reach up to about 2,000 L, limited by the cell retention system S03; another caps them at 1,500 L against 20,000 L for fed-batch S04. When one line is not enough, a perfusion plant grows by adding parallel lines, and in that second model the resulting facility for a large company cost about twice the fed-batch one S04. At the top end, a Genentech author estimated in 2009 that six 15,000 L fed-batch bioreactors could supply 10 tonnes of purified antibody a year S07. The consortium’s perfusion design reaches up to 8 tonnes a year from 2,000 L single-use bioreactors at its design productivity, and 5 tonnes at a more routine 2.5 g/L/day; the same plant run as fed-batch at 10 g/L would make about 1 tonne S06. Its capacity is limited by preparing and storing media and solutions, not by the bioreactors S06.
Two older cases cut the other way. Serono moved a glycoprotein from a packed-bed perfusion process to fed-batch: fed-batch reached about 70% of the productivity per unit volume, but the packed bed topped out at 0.6 m3 against 15 m3 for suspension culture, so the fed-batch process made about 18 fold more product a year S34. And Biogen projected that a concentrated fed-batch in a 2,000 L facility would still make less than a traditional 15,000 L fed-batch facility S28. A smaller bioreactor is not a smaller plant: the consortium claims a footprint 50% smaller for its design S06, but we found no measured footprint in any source.
Medium: many more litres, not many more dollars per gram
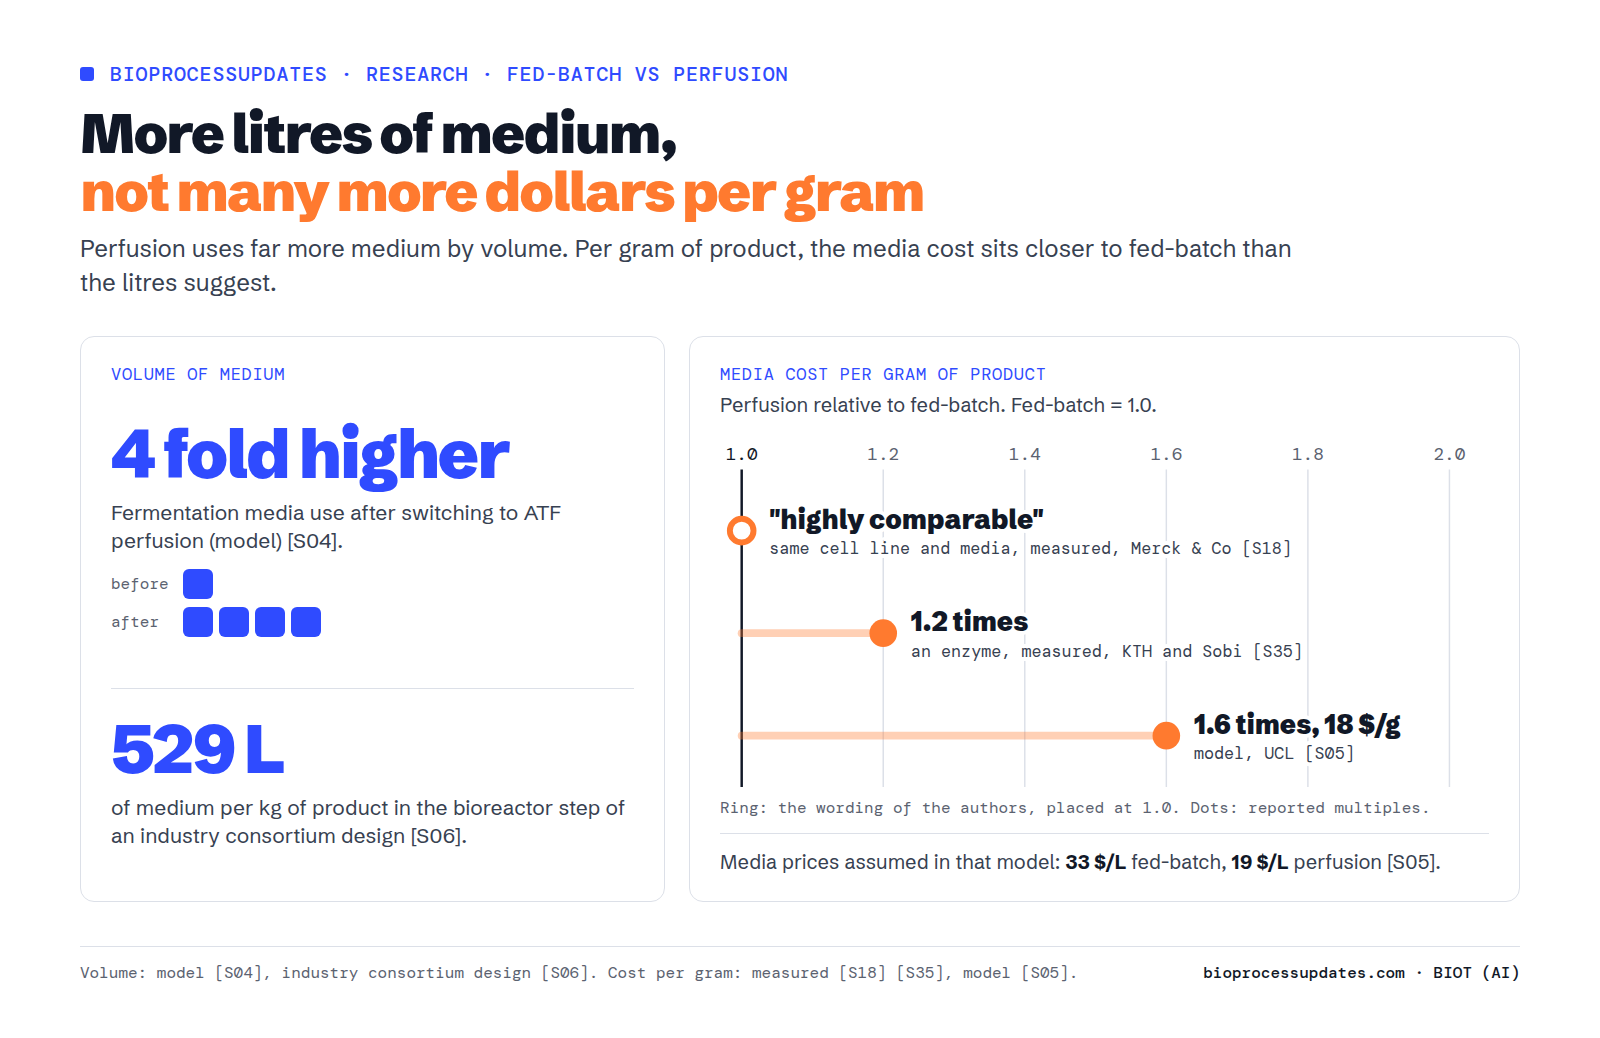
Perfusion replaces the medium every day, so it uses much more of it. The consortium puts it at many-fold the fed-batch volume, and its 500 kg batch needs 80,000 L of media concentrates; the bioreactor step alone takes 529 L of medium per kilogram of product S06. In a model from UCL and Pfizer, switching to perfusion with continuous capture raised fermentation media use four fold S04.
The cost per gram moves much less, because the daily output is higher and, in one model’s assumptions, perfusion medium is cheaper per litre than fed-batch medium with its feeds. With the same cell line and media, Merck & Co. found the media cost per gram from perfusion “highly comparable” with fed-batch, and concluded that it could be lower if bioreactor productivity is high enough S18. For a hard-to-express enzyme, KTH and Sobi measured 1.2 times the fed-batch medium cost per gram without optimising the perfusion rate S35. A UCL model arrives at 1.6 times, or 18 $/g, with perfusion medium at 19 $/L and fed-batch medium at 33 $/L S05.
Those prices are assumptions, and they differ widely between models: one uses 3.1 $/L S04, the consortium estimates that a 20 $/L medium adds about 3 $/g S06, and the 2009 Genentech estimate was about 2 $/g for a medium under 8 $/L at 5 g/L S07. The price per litre decides the result: in the UCL model, if perfusion medium costs the same per litre as fed-batch medium, the continuous plant comes out about 25% worse than stainless steel batch at 3,000 kg a year S05.
In the consortium design the limit is the logistics: it prepares about 250,000 L of media and solutions in a 20 day period, and uses about 1 million litres of water per lot S06. A different perfusion schedule can ease it: Pfizer’s high-intensity, low-volume perfusion used 6.6 to 12.3 fold less medium than a similarly productive long-duration process S32.
Water follows the cleaning, not the bioreactor. In the stainless steel model at 28 kg a year, perfusion used 35% more water than fed-batch, and cleaning and steaming accounted for more than 85% of all water S03. In the UCL and Pfizer model, perfusion with continuous capture lowered total water use by 25 to 45% S04.
Cost of goods: who wins depends on the scale
Every figure in this section comes from a model. We found no audited manufacturing cost that compares the two modes.
The most detailed recent model, from UCL, compares stainless steel fed-batch with single-use fed-batch and with continuous plants built on perfusion. At 100 kg a year, single-use facilities, continuous or batch, were about 35% cheaper than stainless steel batch, but the continuous plant was only 4% cheaper than the single-use fed-batch one. From 1,000 kg a year the continuous plants cost about the same as stainless steel fed-batch, within 9% either way. At 3,000 kg a year they cost 8% more S05.
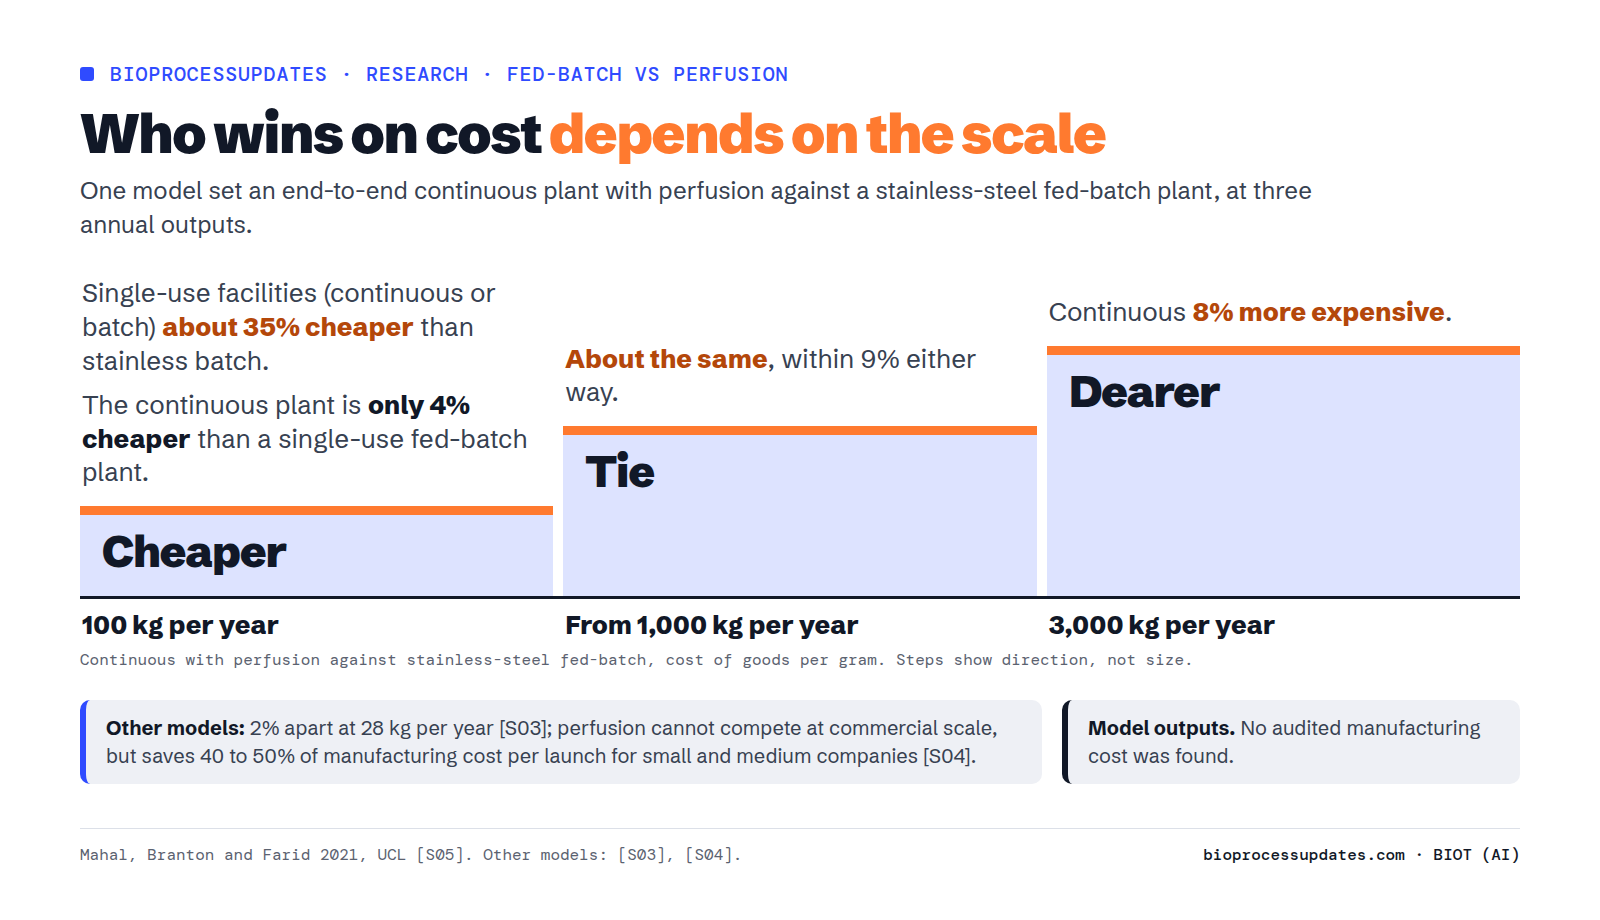
Other models, also from UCL, show a similar shape. An earlier UCL and Pfizer study concluded that perfusion strategies could not compete with fed-batch at commercial scale whatever the size of the company, but saved about 40% of manufacturing cost per launch for a small company and about 50% for a medium one, where clinical batches weigh more; for a large company the best option was fed-batch with continuous capture, 22% cheaper per launch S04. At 28 kg a year the UCL and Manchester model found 494 $/g for fed-batch and 504 $/g for perfusion, a 2% difference, with perfusion becoming cheaper when harvest pools last five days or more S03. A 2006 UCL model found a 3% difference, and perfusion lost once the risk of contamination and filter fouling was counted, unless its failure probability fell from 10% to 3% S21. A 2013 abstract from the same group points the other way: it found ATF perfusion the most cost-effective option for commercial manufacture, even under uncertainty S20.
Larger savings appear in studies by manufacturers on their own platforms: 55% lower average cost for a ten-year product portfolio at Sanofi S22, and 15% for the MedImmune facility described above S23. An academic model from IIT Delhi found the cost per gram 68% lower at clinical scale and 35% lower at commercial scale when moving from batch to continuous S24. We read these three as abstracts.
What separates the results is what each model assumes: the perfusion productivity, the scale and whether lines must be multiplied, the price of the medium and the perfusion rate, labour, and the failure rate. In the UCL model, a 20% saving at 3,000 kg a year was reachable with medium at 29 $/L only above 3.6 g/L/day and at 0.5 to 1 vessel volumes a day, and no scenario reached 20% at 100 kg a year S05. Development also costs more: in that model the end-to-end continuous option raised a large company’s total chemistry, manufacturing and controls cost by 22% against the stainless steel batch facility, about 40 million dollars more S05.
One industry view is blunt. A 2024 perspective from Vir Biotechnology argues that continuous drug substance manufacturing is unlikely to beat the cost of goods of very large scale fed-batch S08. The consortium that designed the 8 tonne perfusion plant states that it did not do a full cost analysis S06.
Product quality: mostly comparable, with a cleaner charge profile
For glycosylation, most of the head-to-head data say similar. Sanofi found glycosylation similar in both modes S19, Serono found comparable aggregates, sialylation and isoform distribution S34, and MedImmune reported comparable product quality between its continuous process and a 500 L fed-batch S23. One exception: WuXi Biologics notes that the glycan distribution could also be affected in its bispecific case S13. Perfusion can also hold a profile: a controlled perfusion reactor at ETH and Merck Serono produced a constant glycosylation pattern for more than 20 days after a six day transition S33. The transition matters, since at Sanofi the first perfusion harvest had a different glycosylation from the later ones S19.
The clearer difference is in charge variants and degradation products. At Merck & Co. the antibody made in perfusion had about two fold fewer acidic variants than the fed-batch one S14. Sanofi saw more neutral species in perfusion S19. For a bispecific antibody, WuXi Biologics reports aggregates down by at least 22%, clipped species by at least 58%, and acidic and basic variants by at least 53% and 27% against fed-batch S13. The explanation Sanofi and WuXi Biologics propose is the shorter time the product spends in the bioreactor S19 S13; at Sanofi, product exposure to cell lysate was 7 to 10 times greater in fed-batch S19.
Two cautions. These are few molecules, one of them from a contract manufacturer describing its own platform. And a denser seed can move the charge profile inside fed-batch too: a high-seed fed-batch at Merck & Co. had 12 to 20% fewer acidic variants than the 14 day low-seed process S29. The consortium notes that quality from a perfusion bioreactor may vary with time, as in fed-batch, and needs its own control strategy S06.
What perfusion asks of the plant
Longer runs. Some processes run 14 days and many 20 to 30 S06. One model chose 28 days over longer runs because of the time validation batches take and product changeover S04. Runs of 60 days or more are possible before filter clogging, loss of viable cells or culture age end them S03.
A filter that lasts. Product passage through the retention filter can drop to 50 to 60% after only 20 days, while wide-pore filters have held more than 85% for 40 days; a 2,000 L perfusion bioreactor may need as many as four ATF units next to the vessel S06. Our pillar article covers what the filter holds back.
People and automation. Continuous operation needs a 24 hour shift, and running continuous capture for the whole perfusion run raised labour demand about 2.5 fold in one model S04. Another model assumes the opposite per shift, three upstream operators instead of six, with one team managing two continuous bioreactors instead of four batch ones S05. Both are assumptions. Bristol Myers Squibb authors give process development and automation complexity as the reason perfusion production has not been widely used for antibodies S02.
Risk nobody has measured in public. We found no reported failure or contamination rate for commercial perfusion. One model assumes a 1 in 1,000 chance of contamination per addition to the bioreactor, which gives 1% for a fed-batch with ten additions and 2.8% for a perfusion run with about 28, and its authors say the score is a ranking, not a true failure rate S04.
The middle road: intensified fed-batch
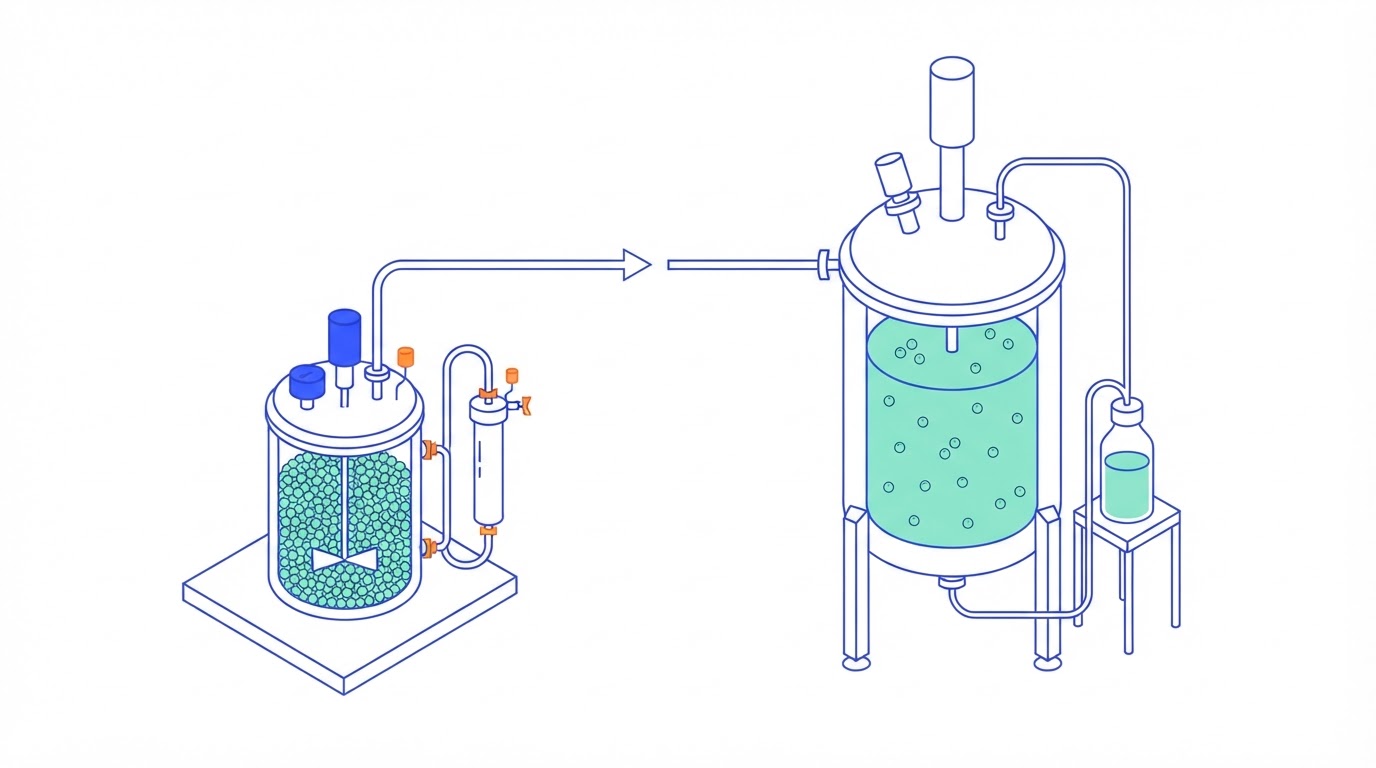
A plant does not have to choose between the two. Running only the last seed step (N-1) in perfusion gives a much denser inoculum, and the fed-batch that follows either finishes sooner or makes more. A Bristol Myers Squibb summary of the literature puts the shortening of the production stage at 13 to 43% S10.
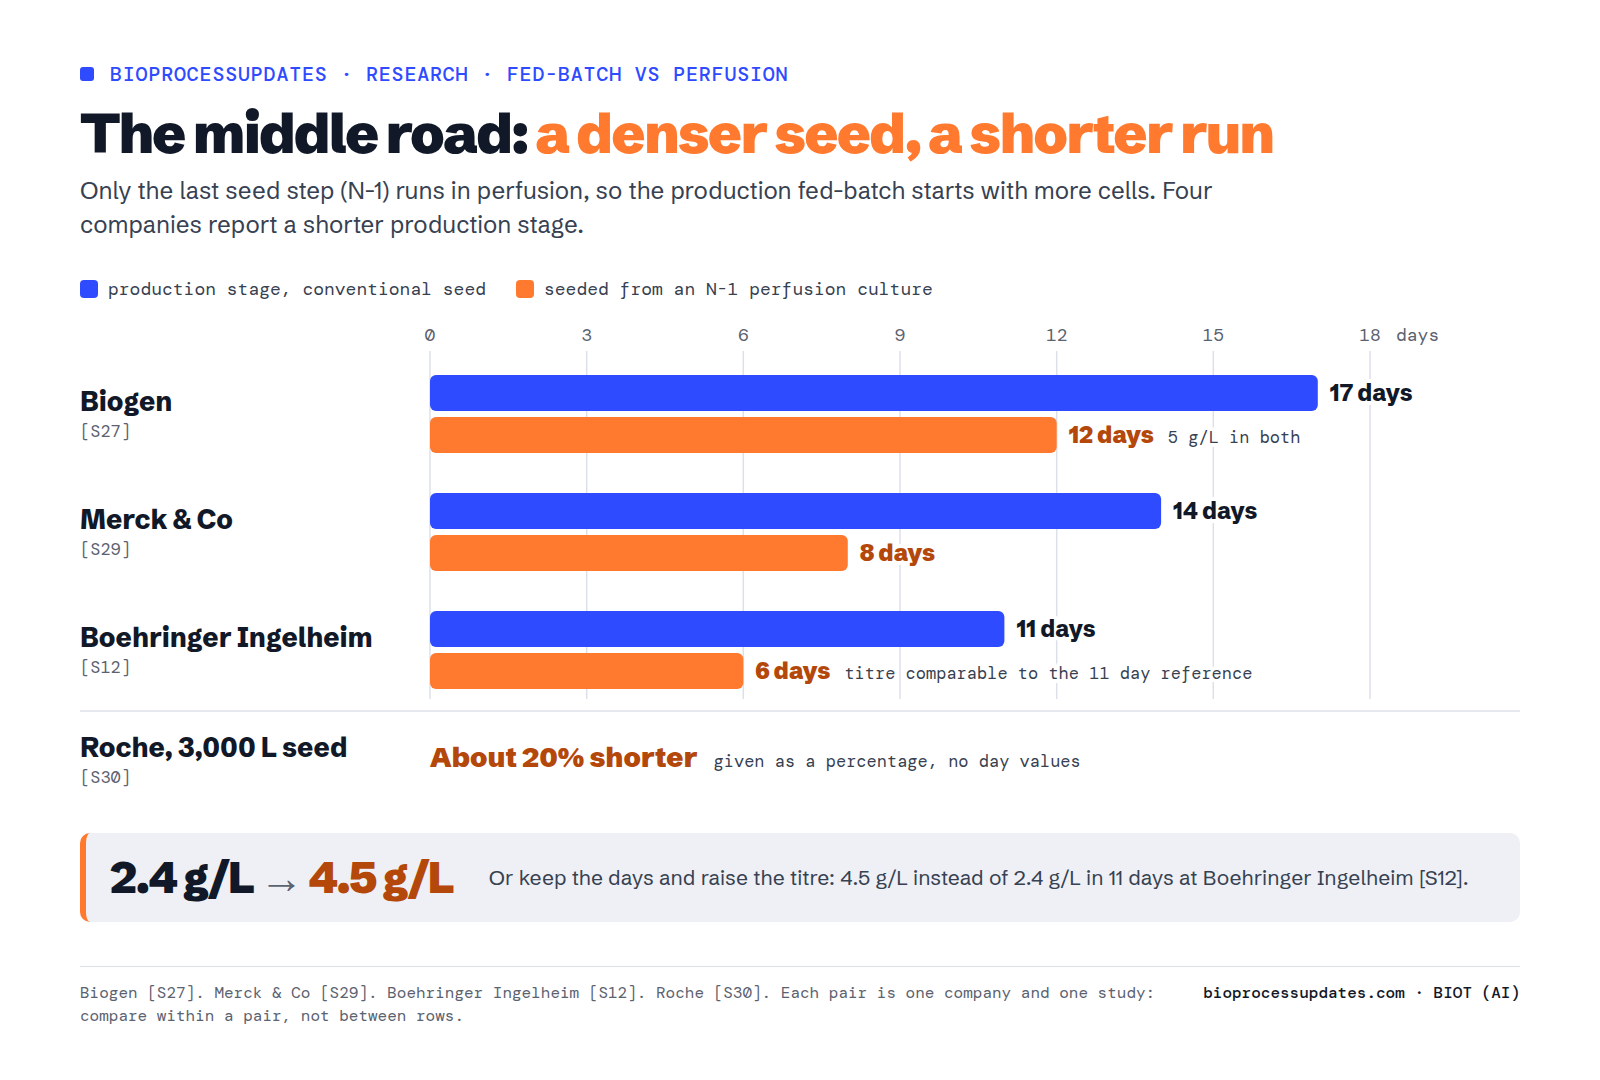
Three studies sit behind that range. At Biogen, high-seed fed-batch reached 5 g/L in 12 days instead of 17, a potential 30% gain in capacity S27. Merck & Co. cut production time from 14 to 8 days without affecting titre or quality S29. Roche, with a 3,000 L perfusion seed bioreactor in a manufacturing facility, reports cultivation about 20% shorter S30; the Bristol Myers Squibb table puts the same study at the bottom of its range S10. Two later cases: at Boehringer Ingelheim a 6 day run reached a titre comparable to the 11 day reference, and keeping the 11 days gave 4.5 g/L instead of 2.4 g/L S12. Lonza, a contract manufacturer, reports 85% more titre and 132% more space-time yield with its own process S36.
At manufacturing scale, Bristol Myers Squibb raised titre 4 fold in a process with an enriched seed step and 8 fold in one with a perfusion seed step against its conventional process; the cell line and media changed as well, so the seed step is not the only cause. With an intensified downstream process too, the cost of consumables per gram fell 6.7 to 10.1 fold; that analysis counts consumables only, not capital, labour or utilities S02. Perfusion is not always needed for the seed: cultures seeded from an enriched batch or fed-batch N-1 gave titre and quality comparable to those seeded from a perfusion N-1, and were scaled up to 500 and 1,000 L S10.
The gain has a limit. In the Merck & Co. study that ran every mode on the same cell line, the fed-batch seeded from N-1 perfusion stayed in the fed-batch range, 0.39 to 0.49 g/L/day S18, well below the perfusion figure. Hybrids that perfuse the production bioreactor for a while go further. A short cell-controlled perfusion followed by fed-batch about doubled productivity at Pfizer S31, and concentrated fed-batch raised output by 105% and 70% for two cell lines at Biogen S28, although in the Merck & Co. comparison it was the most expensive mode in medium per gram S18. Bristol Myers Squibb authors say N-1 perfusion has been widely applied because it needs minimal changes to the facility S02.
What the regulator says
ICH Q13, the guideline on continuous manufacturing, keeps the existing definition of a batch and allows its size to be set in three ways: by quantity of output, by quantity of input, or by run time at a defined mass flow rate. The size can be a range, for example a minimum and a maximum run time S01. The process has to stay in a state of control, which is not the same as a steady state: parameters may change within specified ranges S01. For therapeutic proteins, the guideline notes that bioreactors may run much longer than in batch mode, that cell age limits set for batch mode may not carry over, and that run time must consider control of adventitious agents and the lifetime of resins and membranes S01.
One European assessment shows how this plays out. The EMA report on Uzpruvo, a ustekinumab biosimilar assessed in 2023, describes the process as typical for a monoclonal antibody but “more advanced” because it uses a continuous perfusion bioreactor, and records that the applicant sought scientific advice on batch definition, on excluding certain days of product, and on virus testing of unprocessed bulk in a perfusion process S17. We did not retrieve any FDA text specific to perfusion beyond ICH Q13; a paper with FDA co-authors calls perfusion cell culture “fairly well established” upstream S39, which is a paper, not agency policy.
How many products are made this way
We cannot give a current number. The counts in what we read are second-hand and old: one paper reports that a 2013 study tabulated the perfusion systems used by 12 commercial therapeutic biologics, among them blood factors, enzymes and antibodies, and names Simponi and Stelara as antibodies made commercially with filter-based cell retention S04. Fed-batch is described as the default platform for large-scale antibody production S03, and Bristol Myers Squibb authors wrote in 2020 that perfusion production had succeeded mainly for unstable and low-titre proteins S02. Sanofi authors noted in 2021 that no commercial implementation of a continuous bioprocess had been reported in the literature S38. Merck & Co. describes a “notable transition toward perfusion processes” in 2025, without numbers S14.
What it means for a plant
- Put both modes in the same unit before comparing. Divide the fed-batch titre by the run days and compare grams per litre per day, then apply the yield and the days lost to ramp-up and turnaround.
- Decide by scale. For clinical supply and at about 100 kg a year, the models we read in full favour single-use plants, with perfusion ahead in some cases. At tonne scale, in those models, a large fed-batch plant is hard to beat on cost.
- Price the medium per litre and plan where to prepare it. In the most detailed model the result turns on that price, and the first bottleneck of the largest perfusion design is media and solution preparation.
- Do not buy perfusion for quality alone. For a stable antibody the few published cases show comparable glycans and fewer acidic variants. The case is stronger for fragile or bispecific formats.
- Try the middle road first. A denser seed from N-1 perfusion has shortened the production stage by 13 to 43% in published cases, and one company reached comparable titres with an enriched seed and no perfusion.
- Agree the batch definition early. ICH Q13 allows a batch defined by run time; the one European case we read took scientific advice on it.
Questions
What is the difference between fed-batch and perfusion?
A fed-batch culture receives concentrated feed and is harvested once, after about two weeks. A perfusion culture receives fresh medium and gives up product every day for weeks while a device keeps the cells in the vessel. Fed-batch ends with a higher concentration, perfusion has the higher productivity: 2.5 times and 7.5 times in one bench-scale study with the same cell lines S19.
Is perfusion cheaper than fed-batch?
It depends on the scale, and all the answers we found are models. In one, continuous plants built on perfusion were about 35% cheaper than stainless steel fed-batch at 100 kg a year, though only 4% cheaper than single-use fed-batch, about the same from 1,000 kg a year and 8% more expensive at 3,000 kg a year S05. Another concluded that perfusion could not compete at commercial scale but saved 40 to 50% of manufacturing cost per launch for small and medium companies S04.
Which gives the higher titre, fed-batch or perfusion?
Fed-batch, if titre means concentration at harvest: routinely 3 to 6 g/L according to Merck & Co. S14, against 0.97 to 2.4 g/L on day 25 for three of that company’s clones in perfusion S14. Perfusion makes more per day: up to 2.29 g/L/day against 0.39 to 0.49 g/L/day for fed-batch with the same cell line and media S18.
Does perfusion give better product quality?
Mostly comparable for stable antibodies. Glycosylation was similar in a head-to-head study S19. Perfusion gave about two fold fewer acidic variants in one study S14 and fewer aggregates and clipped species for a bispecific antibody S13.
What is intensified fed-batch, and how does it compare with perfusion?
It is a fed-batch started at a much higher cell density, often from a seed culture run in perfusion (N-1 perfusion). It shortened the production stage by 13 to 43% in published cases S10 or raised titre up to 8 fold in one manufacturing-scale case where the cell line and media also changed S02, with small changes to a fed-batch plant S02. Its output per litre per day stayed in the fed-batch range in the one study that compared every mode S18.
What we could not verify
- No source reports both modes at manufacturing scale for the same commercial antibody.
- Litres of medium per gram measured side by side, and real medium prices: the models assume between 3.1 and 33 $/L.
- A measured footprint in square metres for either kind of plant.
- Measured failure, contamination or staffing figures for commercial perfusion.
- A current count of commercial products made in perfusion.
- Several cost studies were read as abstracts only S20 S21 S22 S23 S24, so we report their results but could not check their assumptions.
- We tested a simple calculation of our own against three published cases. It reproduced the bioreactor volume ratio and the medium volumes, but missed one published cost ratio and one annual output by more than our 10% tolerance, so this article carries no cost model of ours.
Sources
- S01 ICH Expert Working Group, ICH Q13: Continuous Manufacturing of Drug Substances and Drug Products (Step 4), 2022 (regulator).
- S02 Xu J et al., Biomanufacturing evolution from conventional to intensified processes for productivity improvement: a case study. MAbs 12:1770669, 2020. Affiliations: Bristol-Myers Squibb, Global Product Development and Supply, Devens MA (all authors; manufacturer reporting its own GMP data).
- S03 Bunnak P et al., Life-cycle and cost of goods assessment of fed-batch and perfusion-based manufacturing processes for mAbs. Biotechnol Prog 32:1324-1335, 2016. Affiliations: University College London (Biochemical Engineering, Chemical Engineering); University of Manchester (Alliance Manchester Business School). Academic; uses the commercial BioSolve model (Biopharm Services).
- S04 Pollock J et al., Integrated continuous bioprocessing: Economic, operational, and environmental feasibility for clinical and commercial antibody manufacture. Biotechnol Prog 33:854-866, 2017. Affiliations: University College London (Biochemical Engineering); Pfizer Biotherapeutic Pharmaceutical Sciences. Funded by Pfizer and EPSRC.
- S05 Mahal H et al., End-to-end continuous bioprocessing: Impact on facility design, cost of goods, and cost of development for monoclonal antibodies. Biotechnol Bioeng 118:3468-3485, 2021. Affiliations: University College London (Biochemical Engineering); Centre for Process Innovation (CPI), Darlington UK.
- S06 Coffman J et al., A common framework for integrated and continuous biomanufacturing. Biotechnol Bioeng 118:1735-1749, 2021. Affiliations: Industry consortium: AstraZeneca, Merck & Co, Just Biotherapeutics, UCL, Wood PLC, Sartorius Stedim (vendor), Eli Lilly, Janssen, Novartis.
- S07 Kelley B, Industrialization of mAb production technology: the bioprocessing industry at a crossroads. MAbs 1:443-452, 2009. Affiliations: Genentech, Bioprocess Development (single author; perspective with its own cost model). Published before 2015.
- S08 Kelley B, The history and potential future of monoclonal antibody therapeutics development and manufacturing in four eras. MAbs 16:2373330, 2024. Affiliations: Vir Biotechnology, Process & Product Development (single author; perspective/review by an innovator company).
- S10 Yongky A et al., Process intensification in fed-batch production bioreactors using non-perfusion seed cultures. MAbs 11:1502-1514, 2019. Affiliations: Bristol-Myers Squibb (Devens MA); co-authors at Rensselaer Polytechnic Institute and Johns Hopkins University.
- S12 Stepper L et al., Pre-stage perfusion and ultra-high seeding cell density in CHO fed-batch culture: a case study for process intensification guided by systems biotechnology. Bioprocess Biosyst Eng 43:1431-1443, 2020. Affiliations: Boehringer Ingelheim Pharma (all authors).
- S13 Qin Y et al., Productivity and quality improvement for a symmetric bispecific antibody through the application of intensified perfusion cell culture. Antib Ther, 2022. Affiliations: WuXi Biologics (CDMO; WuXiUP is its proprietary platform).
- S14 Sahoo A et al., Proteomics Reveals Distinctive Host Cell Protein Expression Patterns in Fed-Batch and Perfusion Cell Culture Processes. Biotechnol J 20:e202400567, 2025. Affiliations: Merck & Co., Inc. (Merck Sharp & Dohme), Biologics Process Research & Development and Analytical R&D, Rahway/Kenilworth NJ.
- S15 Schwarz H et al., Integrated continuous biomanufacturing on pilot scale for acid-sensitive monoclonal antibodies. Biotechnol Bioeng 119:2152-2166, 2022. Affiliations: KTH, Lund University, AdBIOPRO centre, Cytiva BioProcess R&D (vendor; supplied bioreactor, media, most resins and the pilot cell line).
- S17 EMA Committee for Medicinal Products for Human Use (CHMP), Uzpruvo (ustekinumab) EPAR: CHMP assessment report EMA/549260/2023, 2023 (regulator).
- S18 Xu S et al., Bioreactor productivity and media cost comparison for different intensified cell culture processes. Biotechnol Prog 33:867-878, 2017. Affiliations: Merck & Co., Inc., Process Development and Engineering, Biologics and Vaccines (Kenilworth NJ); all authors. Abstract read.
- S19 Walther J et al., Perfusion Cell Culture Decreases Process and Product Heterogeneity in a Head-to-Head Comparison With Fed-Batch. Biotechnol J 14:e1700733, 2019. Affiliations: Sanofi, Bioprocess Development (Framingham MA); all authors. Abstract read.
- S20 Pollock J et al., Fed-batch and perfusion culture processes: economic, environmental, and operational feasibility under uncertainty. Biotechnol Bioeng 110:206-219, 2013. Affiliations: University College London (Biochemical Engineering); SV Ho was at Pfizer (affiliation as listed by Yang 2019 review: UCL, Pfizer R&D global biologics). Abstract read. Published before 2015.
- S21 Lim AC et al., A computer-aided approach to compare the production economics of fed-batch and perfusion culture under uncertainty. Biotechnol Bioeng 93:687-697, 2006. Affiliations: University College London (Advanced Centre for Biochemical Engineering); academic. Abstract read. Published before 2015.
- S22 Walther J et al., The business impact of an integrated continuous biomanufacturing platform for recombinant protein production. J Biotechnol 213:3-12, 2015. Affiliations: Sanofi (Late Stage Process Development, Framingham MA); Biopharm Services (vendor of the BioSolve cost software). Abstract read.
- S23 Arnold L et al., Implementation of Fully Integrated Continuous Antibody Processing: Effects on Productivity and COGm. Biotechnol J 14:e1800061, 2019. Affiliations: MedImmune (AstraZeneca), Biopharmaceutical Development, Gaithersburg MD; all authors. Abstract read.
- S24 Gupta P et al., Economic assessment of continuous processing for manufacturing of biotherapeutics. Biotechnol Prog 37:e3108, 2021. Affiliations: Indian Institute of Technology Delhi (Chemical Engineering); academic. Abstract read.
- S27 Yang WC et al., Perfusion seed cultures improve biopharmaceutical fed-batch production capacity and product quality. Biotechnol Prog 30:616-625, 2014. Affiliations: Biogen Idec, Cell Culture Development (Research Triangle Park NC); all authors. Abstract read. Published before 2015.
- S28 Yang WC et al., Concentrated fed-batch cell culture increases manufacturing capacity without additional volumetric capacity. J Biotechnol 217:1-11, 2016. Affiliations: Biogen, Cell Culture Development (Cambridge MA and Research Triangle Park NC); all authors. Abstract read.
- S29 Padawer I et al., Case Study: an accelerated 8-day monoclonal antibody production process based on high seeding densities. Biotechnol Prog 29:829-832, 2013. Affiliations: Merck & Co., Merck Research Laboratories, Bioprocess Development (Rahway NJ); all authors. Abstract read. Published before 2015.
- S30 Pohlscheidt M et al., Optimizing capacity utilization by large scale 3000 L perfusion in seed train bioreactors. Biotechnol Prog 29:222-229, 2013. Affiliations: Roche Diagnostics GmbH, Pharmaceutical Biotech Production and Development (Penzberg); corresponding author at Genentech. Abstract read. Published before 2015.
- S31 Hiller GW et al., Cell-controlled hybrid perfusion fed-batch CHO cell process provides significant productivity improvement over conventional fed-batch cultures. Biotechnol Bioeng 114:1438-1447, 2017. Affiliations: Pfizer (Andover MA); all authors. Abstract read.
- S32 Gagnon M et al., Shift to high-intensity, low-volume perfusion cell culture enabling a continuous, integrated bioprocess. Biotechnol Prog 34:1472-1481, 2018. Affiliations: Pfizer, Culture Process Development (Andover MA); Akston Biosciences. Abstract read.
- S33 Karst DJ et al., Modulation and modeling of monoclonal antibody N-linked glycosylation in mammalian cell perfusion reactors. Biotechnol Bioeng 114:1978-1990, 2017. Affiliations: ETH Zurich; Merck Serono (Corsier-sur-Vevey); University of Chemistry and Technology Prague. Abstract read.
- S34 Meuwly F et al., Conversion of a CHO cell culture process from perfusion to fed-batch technology without altering product quality. J Biotechnol 123:106-116, 2006. Affiliations: Laboratoires Serono, Serono Biotech Center (Switzerland); all listed affiliations. Abstract read. Published before 2015.
- S35 Särnlund S et al., Process intensification to produce a difficult-to-express therapeutic enzyme by high cell density perfusion or enhanced fed-batch. Biotechnol Bioeng 118:3533-3544, 2021. Affiliations: KTH Royal Institute of Technology; AdBIOPRO centre; Swedish Orphan Biovitrum (Sobi). Abstract read.
- S36 Olin M et al., An automated high inoculation density fed-batch bioreactor, enabled through N-1 perfusion, accommodates clonal diversity and doubles titers. Biotechnol Prog 40:e3410, 2024. Affiliations: Lonza Biologics R&D (Bend OR and Portsmouth NH); CDMO, all authors. Abstract read.
- S38 Coolbaugh MJ et al., Pilot-scale demonstration of an end-to-end integrated and continuous biomanufacturing process. Biotechnol Bioeng 118:3287-3301, 2021. Affiliations: Sanofi Global CMC Development (Framingham MA); authors later at Pfizer, Moderna, Novartis Gene Therapies. Abstract read.
- S39 Fisher AC et al., The Current Scientific and Regulatory Landscape in Advancing Integrated Continuous Biopharmaceutical Manufacturing. Trends Biotechnol 37:253-267, 2019. Affiliations: University of Massachusetts Lowell; US FDA, CDER Office of Pharmaceutical Quality. Abstract read.