Research 38 primary sources read, 34 cited: papers, vendor-authored studies and ICH Q13
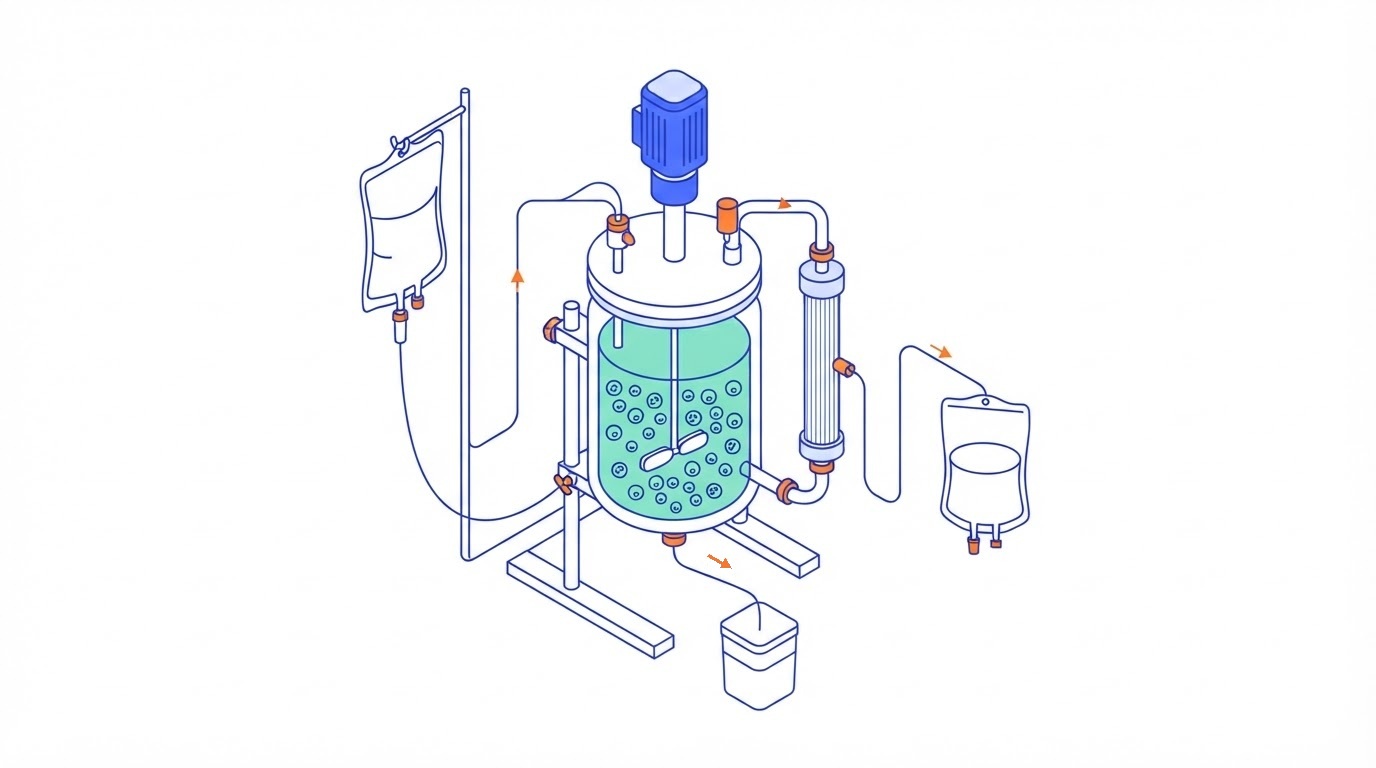
Perfusion keeps a cell culture running for weeks by feeding it fresh medium and taking spent medium out, while a device holds the cells back. It is the upstream half of most continuous biomanufacturing schemes, and ICH Q13 now uses a perfusion bioreactor as its worked example for therapeutic proteins S01. We read 38 primary sources, from 2011 to 2026, to explain how it works and where it costs you. The short version: a perfusion culture is a balance between three flows, and two of them deserve most of the attention on cost: the medium you pay for and the product you throw away with the bleed.
The six findings in short
- Perfusion is three flows in balance, and the bleed is the steering wheel. Fresh medium in, cell-free harvest out, and a bleed of culture that removes the cells the culture grows. At steady state the bleed is what holds the cell density on target. Confidence: high.
- The medium is the bill. The medium each cell needs per day (the CSPR) sets how much you buy. Published steady runs used between about 10 and 70 pL per cell per day, and in two studies getting below about 30 took reinforced or purpose-built media. Confidence: high.
- The bleed throws product away. In a seminal CHO study, bleeds carried off 22 to 32% of all antibody made. Confidence: medium, one detailed study plus supporting ones.
- The filter can hold the product back, and it gets worse with time. Membranes meant to stop only cells also held back part of the antibody, and one team saw retention climb from 20% to 60% over a run. Membrane structure and the pump make a large difference. Confidence: medium.
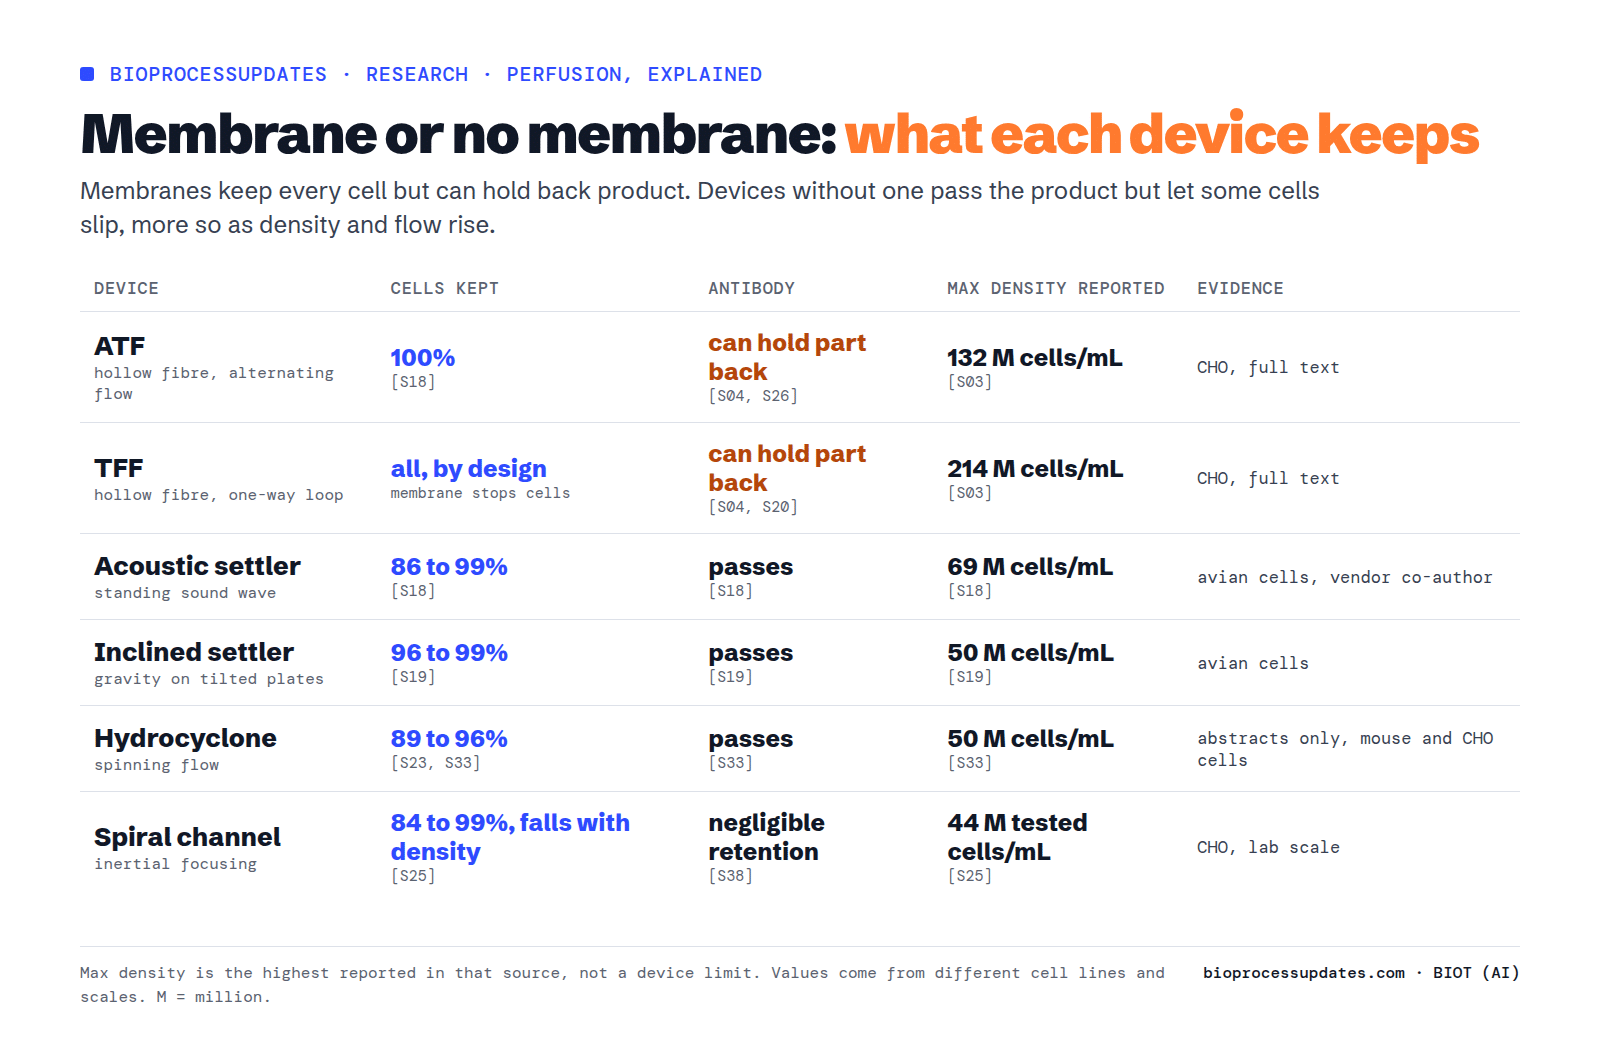
- Devices without a membrane let the product through but let cells slip. Acoustic settlers, inclined settlers, hydrocyclones and spiral channels kept roughly 84 to 99% of cells, and less as density or flow rose. Few of these data are from CHO. Confidence: medium to low.
- You do not need a full perfusion plant to benefit. Running only the seed step (N-1) in perfusion raised fed-batch titres 1.5 to 2 times at two companies. Confidence: high.
How we built this
We read 29 sources in full text and 8 from the abstract only, plus the ICH Q13 guideline. Many are written or co-authored by suppliers of the equipment or media they test, and we flag each one in the source list: Sartorius S11 S13 S37 (and a co-author of S02), Merck Life Science S06, GE Healthcare, now Cytiva S03 S04 S17 S33, Cytiva S05, SonoSep S18 and Thermo Fisher S14. The two Clincke papers from 2013 S03 S04 predate our usual window; we use them because they remain the most complete open data on CHO perfusion at very high density. Where a paper quotes a number from earlier work, we say so and do not attribute it to the citing paper. Each conclusion carries a confidence level: high means several independent sources agree; medium means one detailed study or one company’s data; low means little or no CHO data.
Fed-batch, perfusion and the three flows
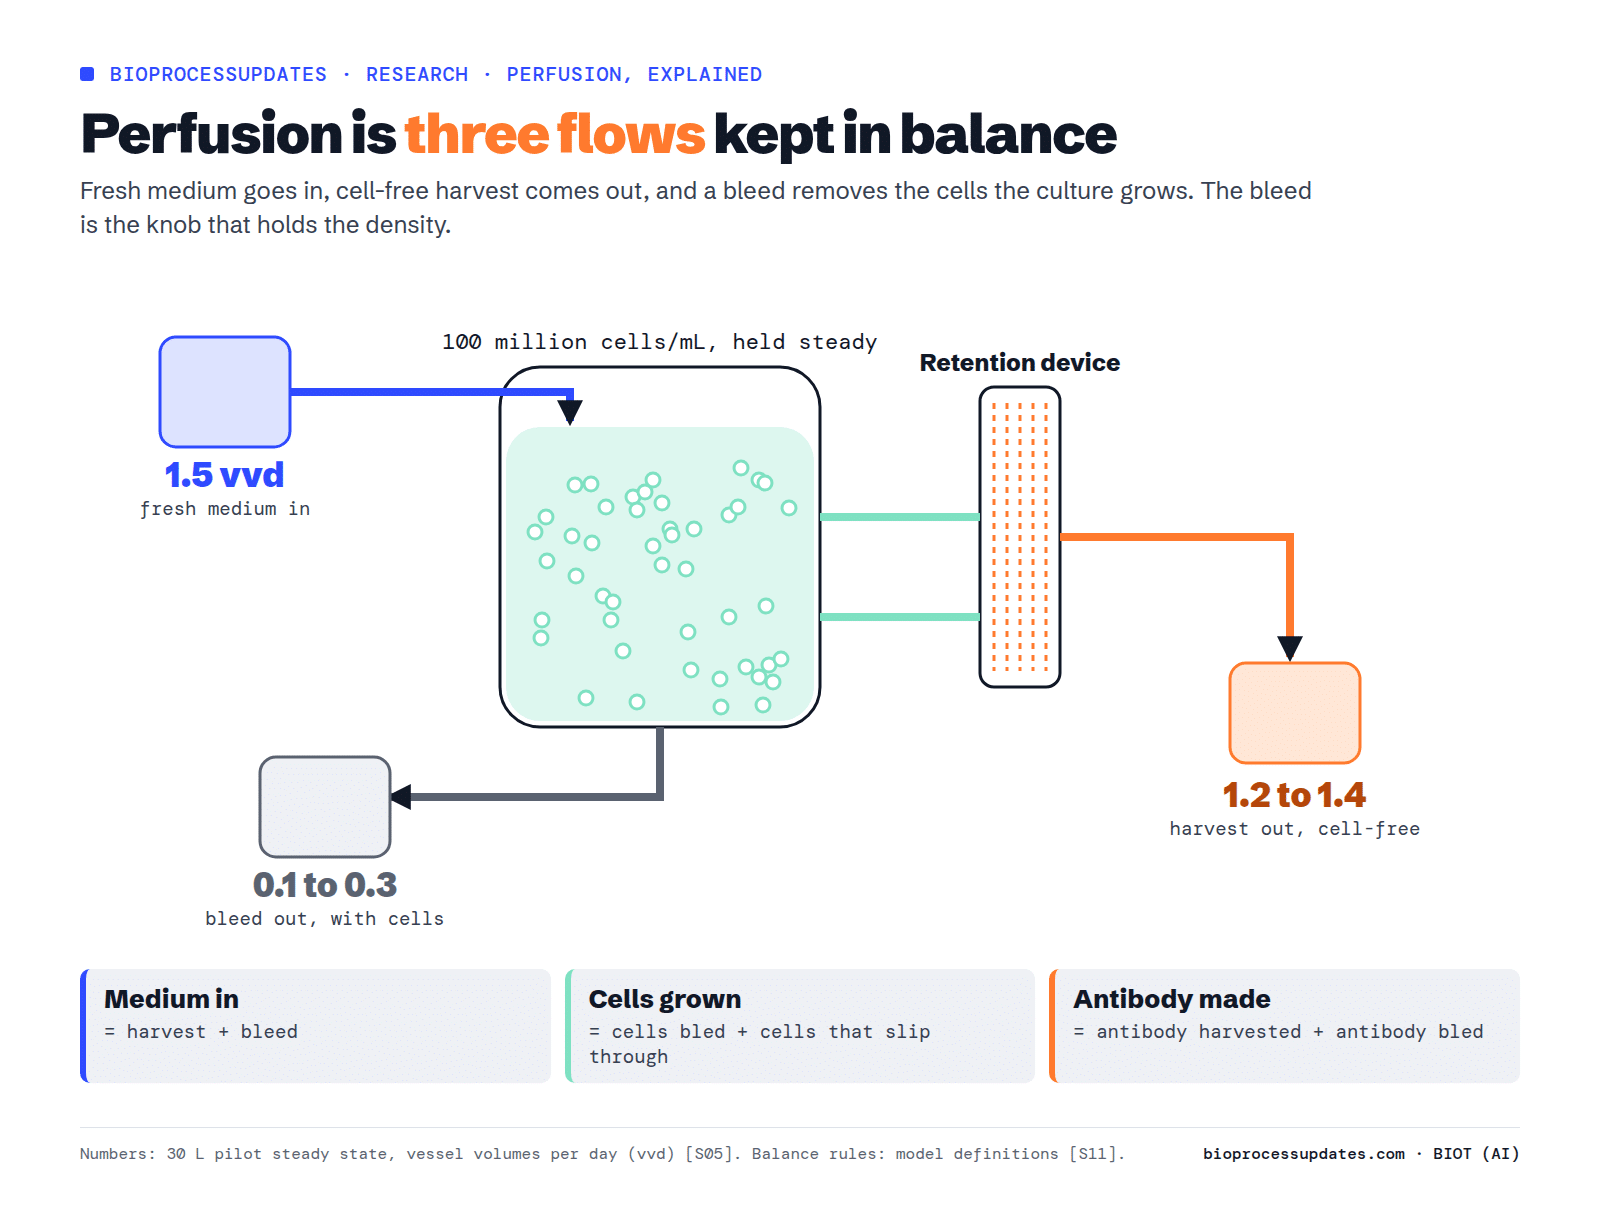
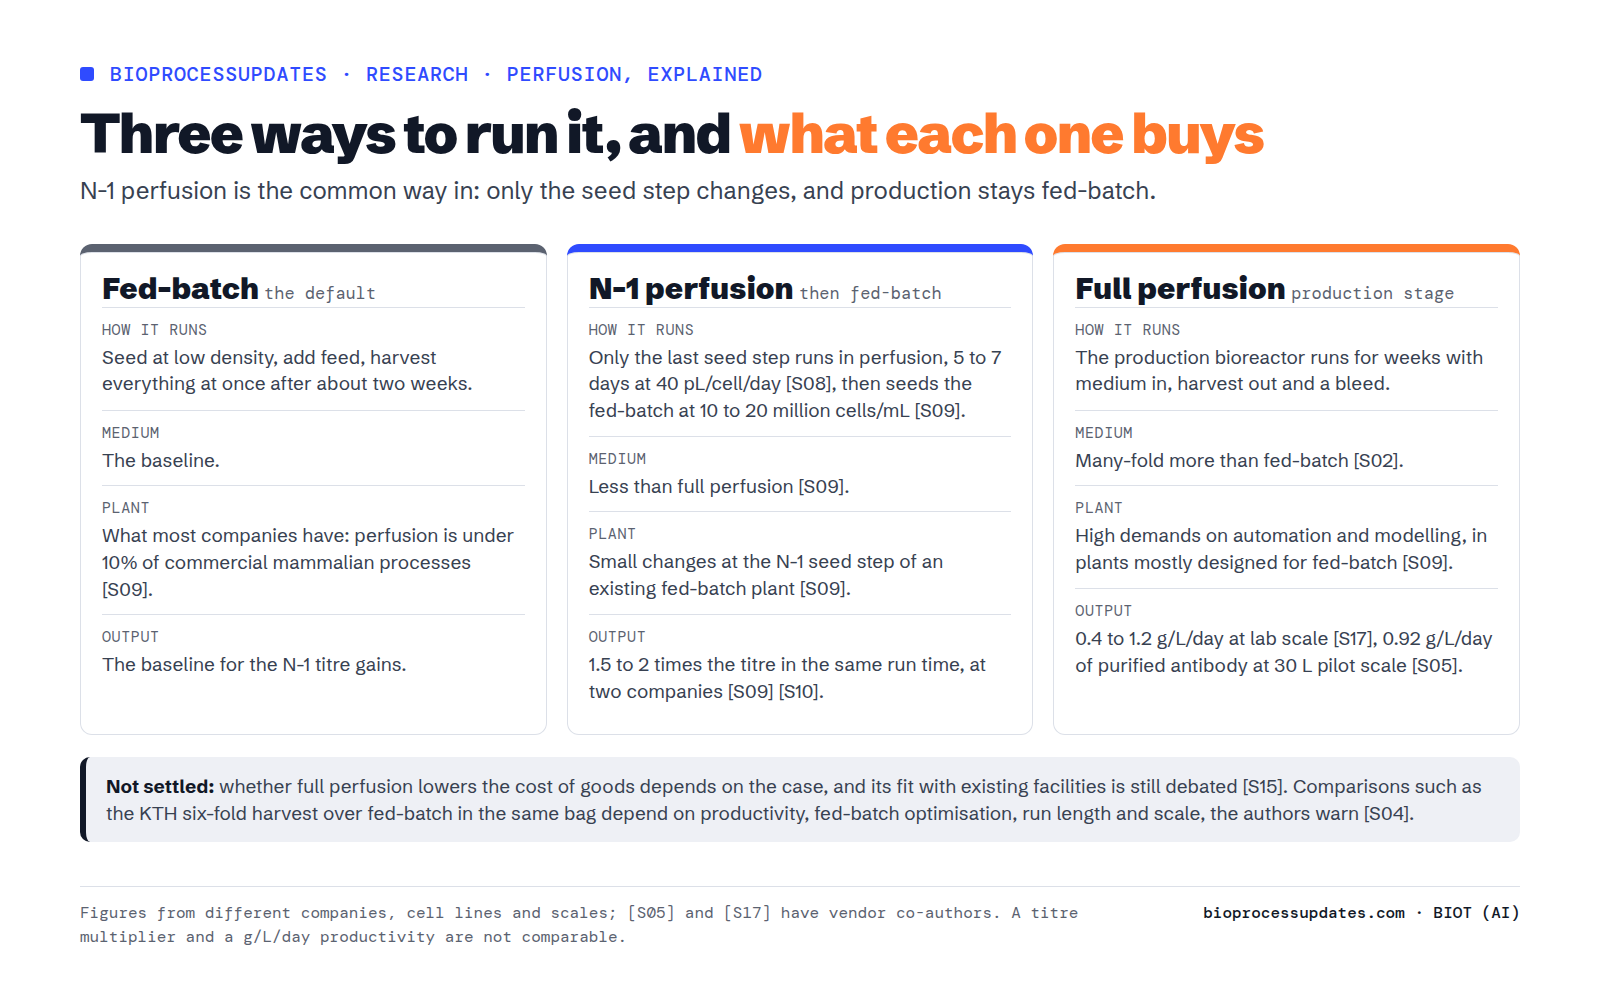
A fed-batch culture starts with a few cells, adds concentrated feed and ends after about two weeks, when everything is harvested at once. Perfusion never stops feeding. Fresh medium enters continuously, a retention device lets clarified liquid leave as the harvest, and a separate bleed stream removes whole culture, cells included S11. Once the culture reaches its target density, the operator keeps it there by adjusting the bleed: the bleed is the manipulated variable S11.
The logic is simple bookkeeping. Every day the cells divide. If the device keeps every cell in the vessel, the only way to stop the density from rising is to remove, through the bleed, as many cells as grew. In the seminal KTH work, CHO cultures held at 20 to 35 million cells/mL with about 1.5 vessel volumes of medium a day grew at about 0.35 per day, and daily bleeds held them there S03. At pilot scale, a 30 L steady state at 100 million cells/mL ran at 1.5 vessel volumes a day, of which 0.1 to 0.3 went to the bleed and 1.2 to 1.4 to the harvest S05.
How dense can it get? The same seminal work reached 214 million cells/mL with TFF and 132 million with ATF, and held 90 to 130 million with bleeds for more than two weeks S03. Those are records, not operating points. More recent runs sit lower: about 54 million cells/mL at lab scale with an automated bleed S37, about 70 million at AstraZeneca S27, 85 to 100 million in a Merck & Co. run S21 and 100 million at 30 L pilot scale S05. An industry consortium uses 50 to 120 million cells/mL as its design basis for commercial N-stage perfusion S02; that is a planning assumption, not a measurement.
Try the balance yourself
The simulator below applies those three bookkeeping rules. Move the sliders and watch where the medium, the cells and the antibody go. It is an illustrative teaching model: it assumes a true steady state, constant growth and productivity and no nutrient limits, and it is not validated against a specific process. The ranges on the sliders follow the published values discussed in this article.
The medium is the bill
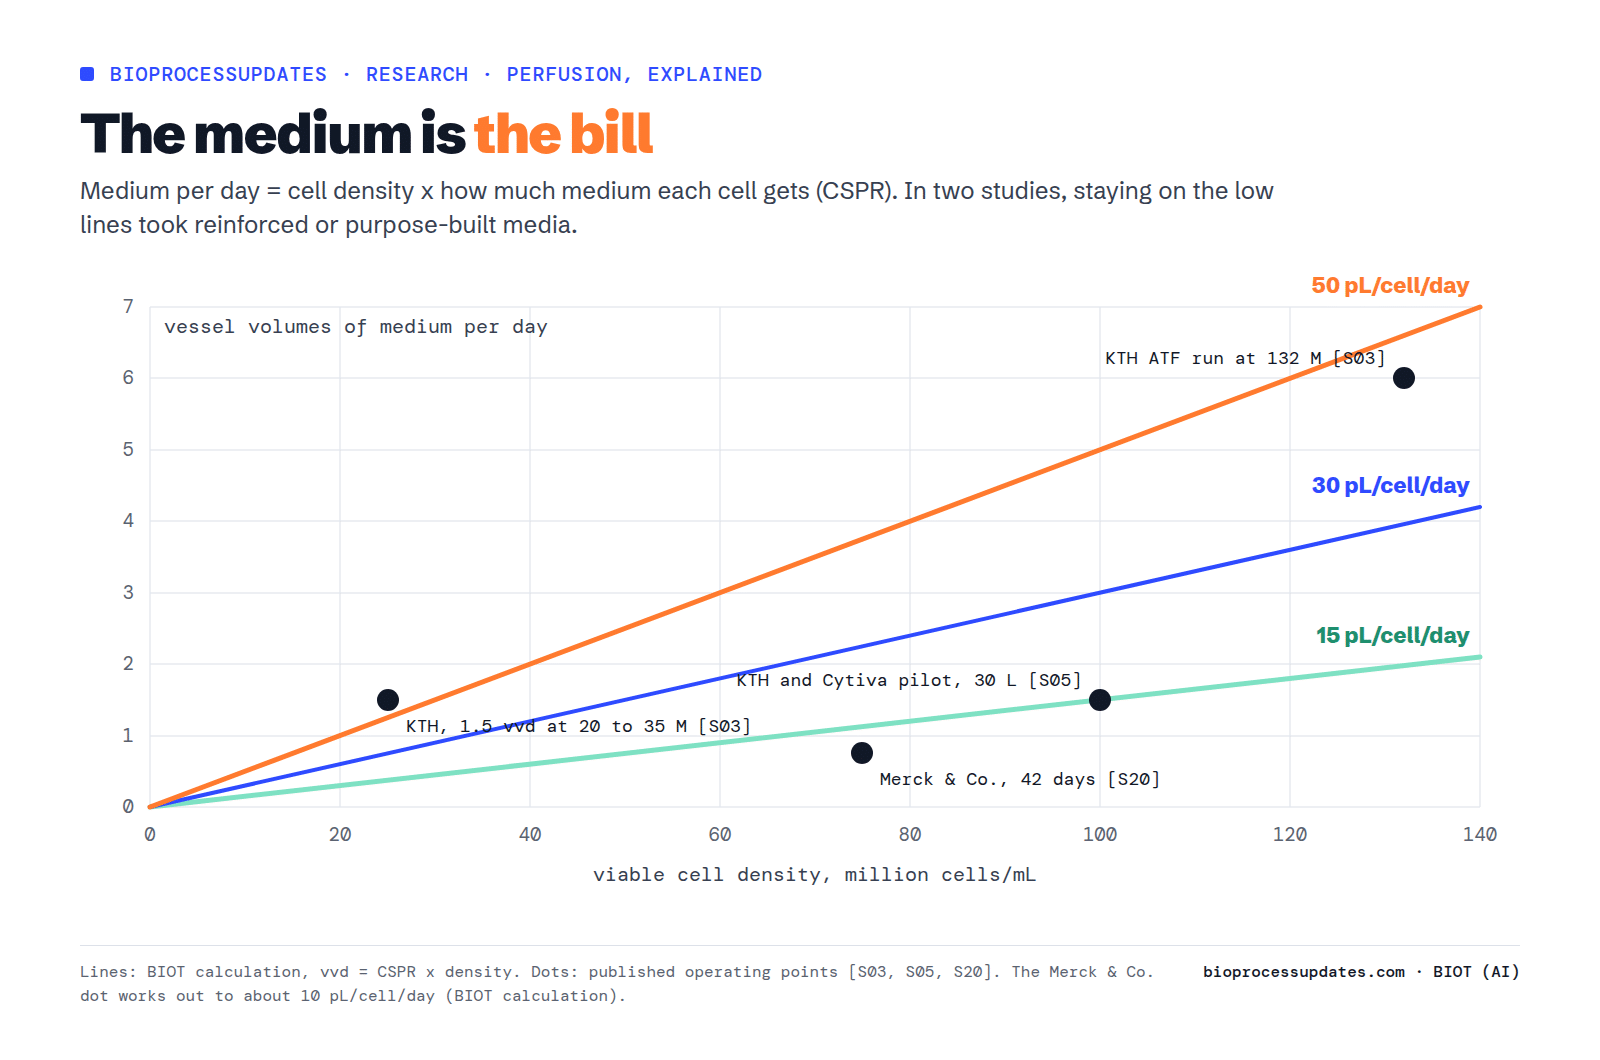
The key number for cost is the cell-specific perfusion rate, or CSPR: how much fresh medium each cell gets per day, usually in picolitres. Multiply it by the cell density and you get the medium flow. Hold CSPR constant and a denser culture needs proportionally more medium: in the KTH ATF run that reached 132 million cells/mL, the perfusion rate reached 6 vessel volumes a day S03.
So the whole game is to lower CSPR without starving the cells. The KTH cultures ran at about 50 to 70 pL/cell/day S03. In the KTH and Cytiva pilot work, the plain medium supported growth at 33 pL/cell/day but performance fell below that unless it was reinforced with concentrated feeds; with reinforcement the production bioreactor ran at 25 and then 15 pL/cell/day S05. BOKU and GE designed clone-specific media that brought the minimum down to 10 to 30 pL/cell/day while still reaching 200 million cells/mL S17. AstraZeneca describes about 20 pL/cell/day as typical for CHO in its proprietary media S27. Not every low value needed special media: a Merck & Co. run held 75 million cells/mL on 0.75 vessel volumes a day of a commercial basal medium, which works out to about 10 pL/cell/day (our calculation) S20.
More medium also buys less than you might expect. Boehringer Ingelheim found that in N-1 perfusion, 176% more medium gave only a 63% higher final cell density S07. Control helps: Bristol Myers Squibb cut medium use by about 25% by pacing the flow to the cell density measured online with a capacitance probe, instead of following a fixed schedule S08. Perfusion media are generally not sold off the shelf and have to be designed per process S17, although they can be built from fed-batch basal media mixed with concentrated feed S02.
The bleed throws product away
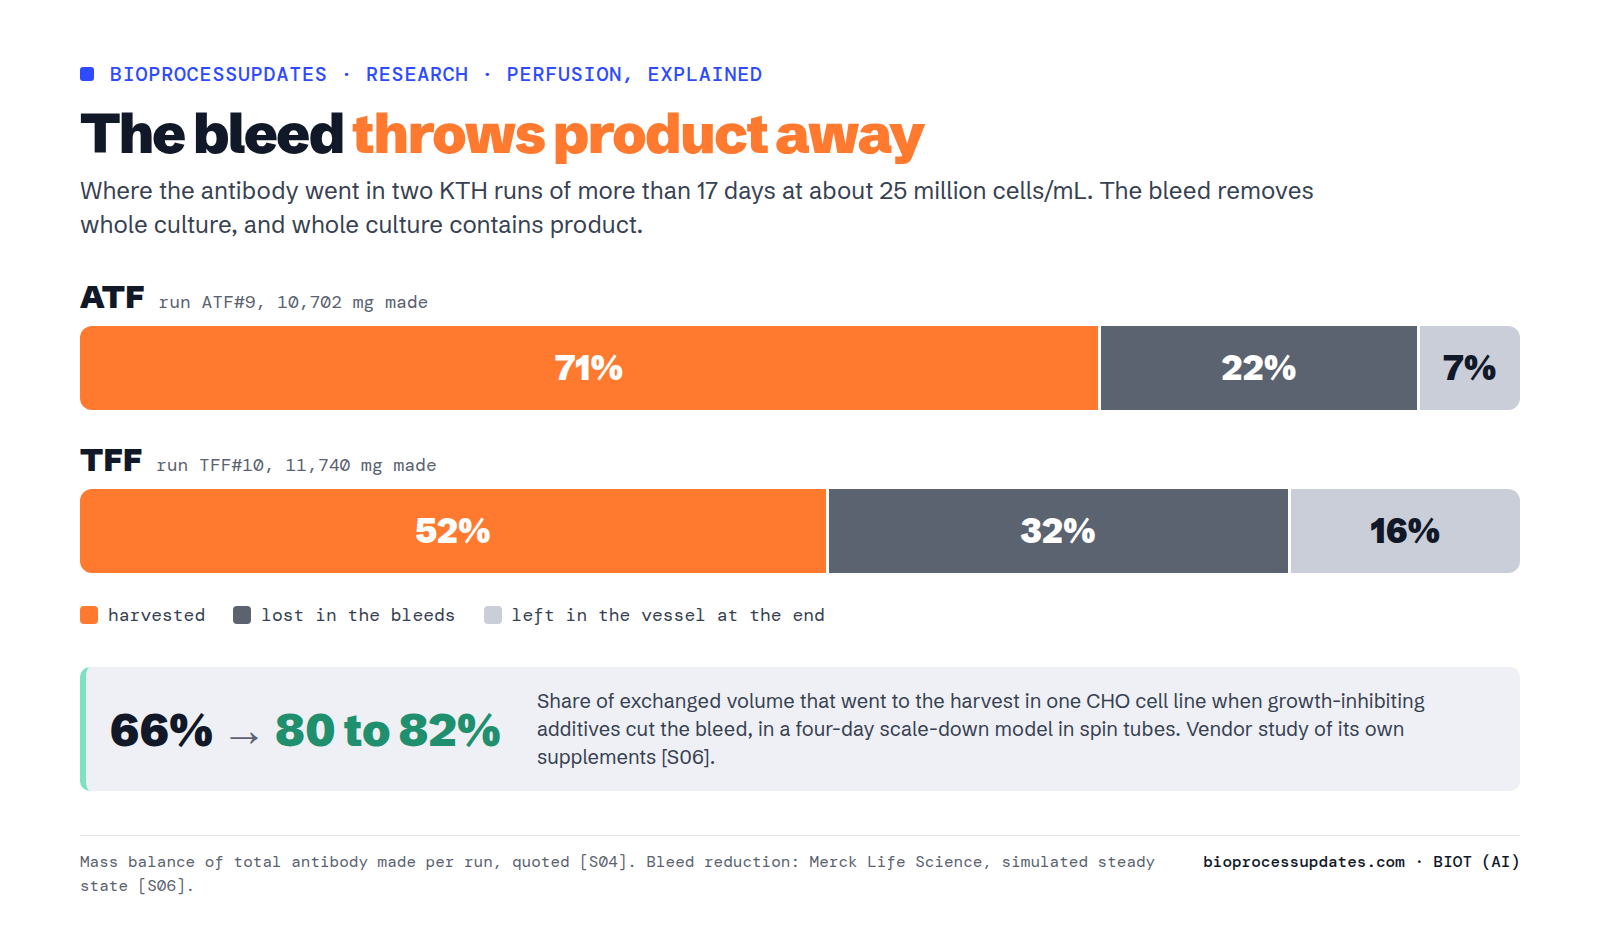
The bleed removes whole culture, and whole culture contains antibody. In KTH runs of more than 17 days at about 25 million cells/mL, the daily bleeds carried off 22% of all the antibody made with ATF and 32% with TFF; the harvest captured 71% and 52% S04. MacDonald and colleagues state that bleeds typically remove 10 to 30% of the culture volume each day, a figure they take from earlier work S14.
Two routes to cut that loss appear in the sources. One slows growth so less bleed is needed: in a four-day Merck Life Science scale-down model, growth-inhibiting additives raised the share of exchanged volume that went to the harvest from 66% to 80 to 82% in one cell line S06. The other engineers the cells: death-resistant CHO lines ran for weeks without any bleed at similar volumetric productivity S14. Both are early: one is a vendor study of its own supplements in spin tubes, the other a research cell line.
When the filter holds back the product
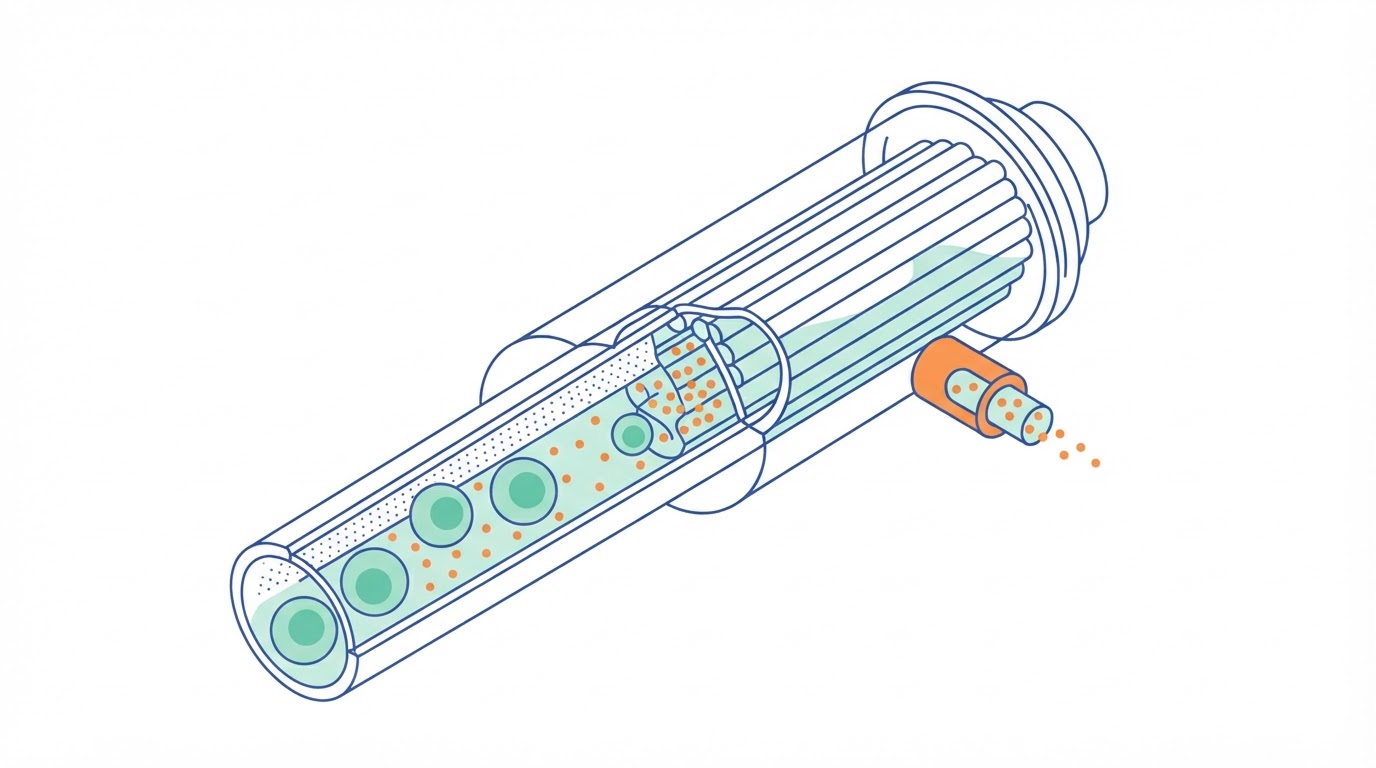
ATF and TFF both push culture along hollow fibres whose walls let liquid through and stop cells. ATF uses a diaphragm pump that pulls culture into the fibres and pushes it back, so the flow alternates; TFF uses a pump that drives it one way round a loop. The membranes are chosen to pass the antibody. In practice they often do not pass all of it.
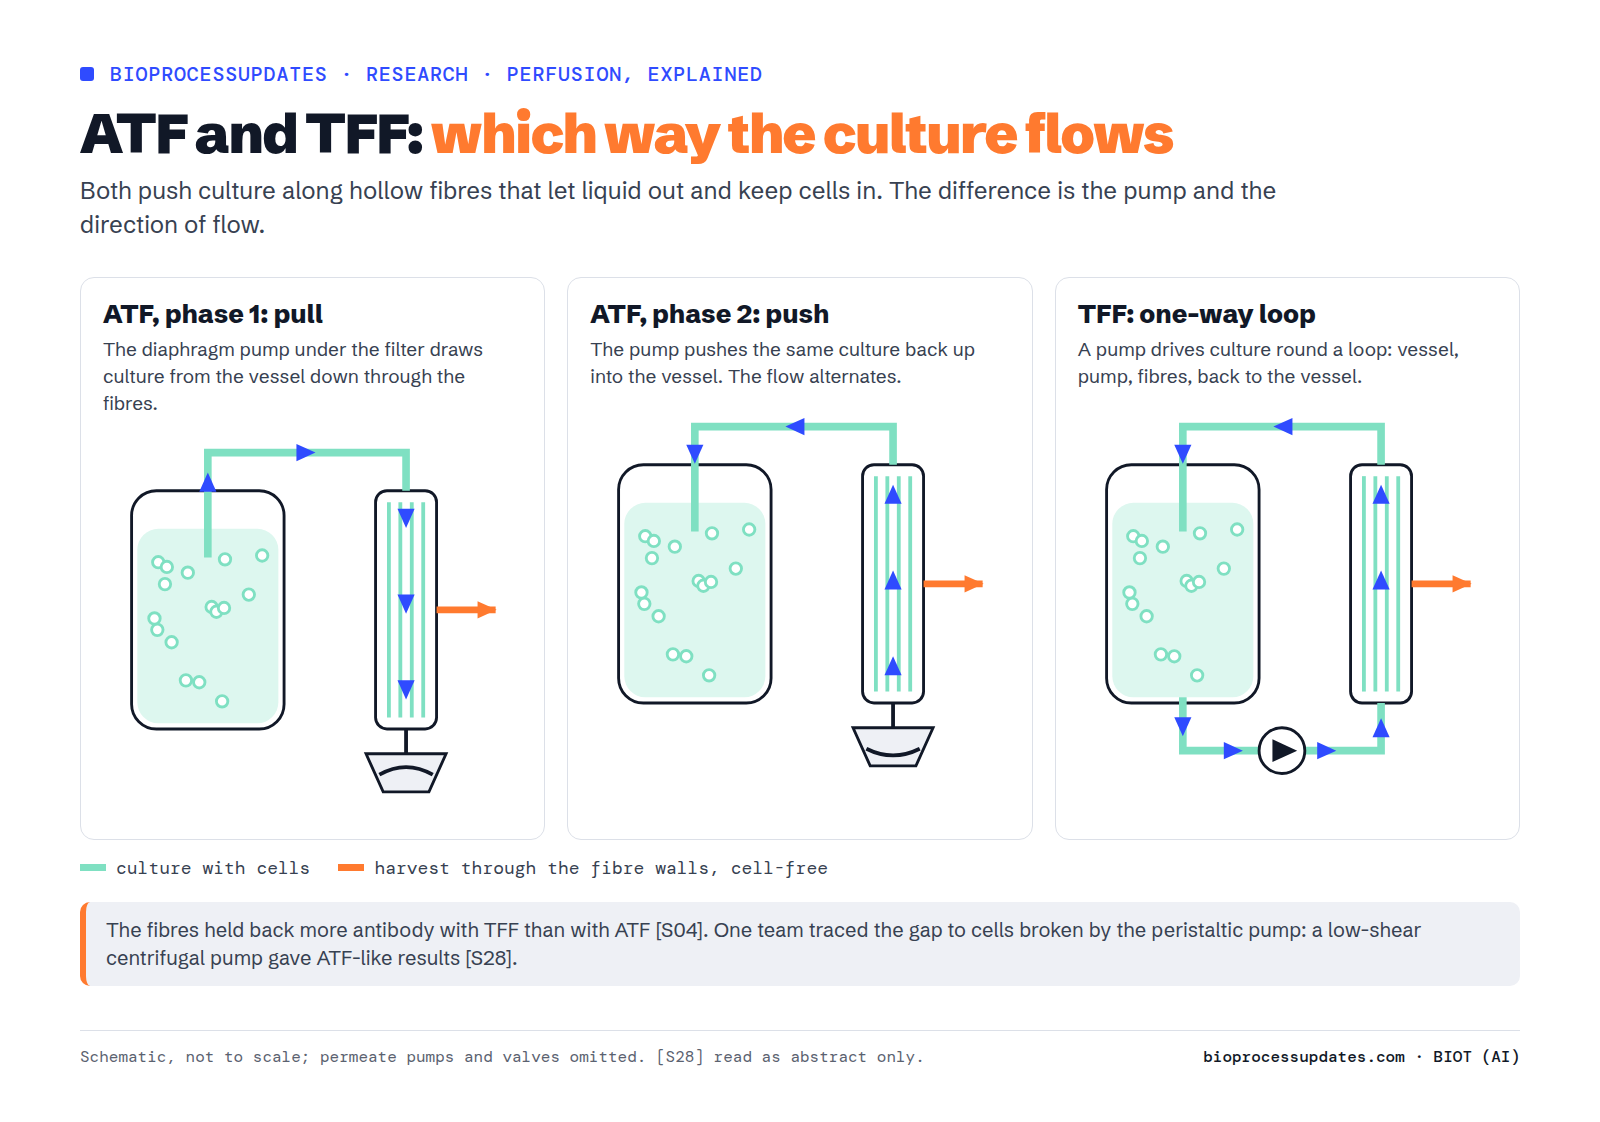
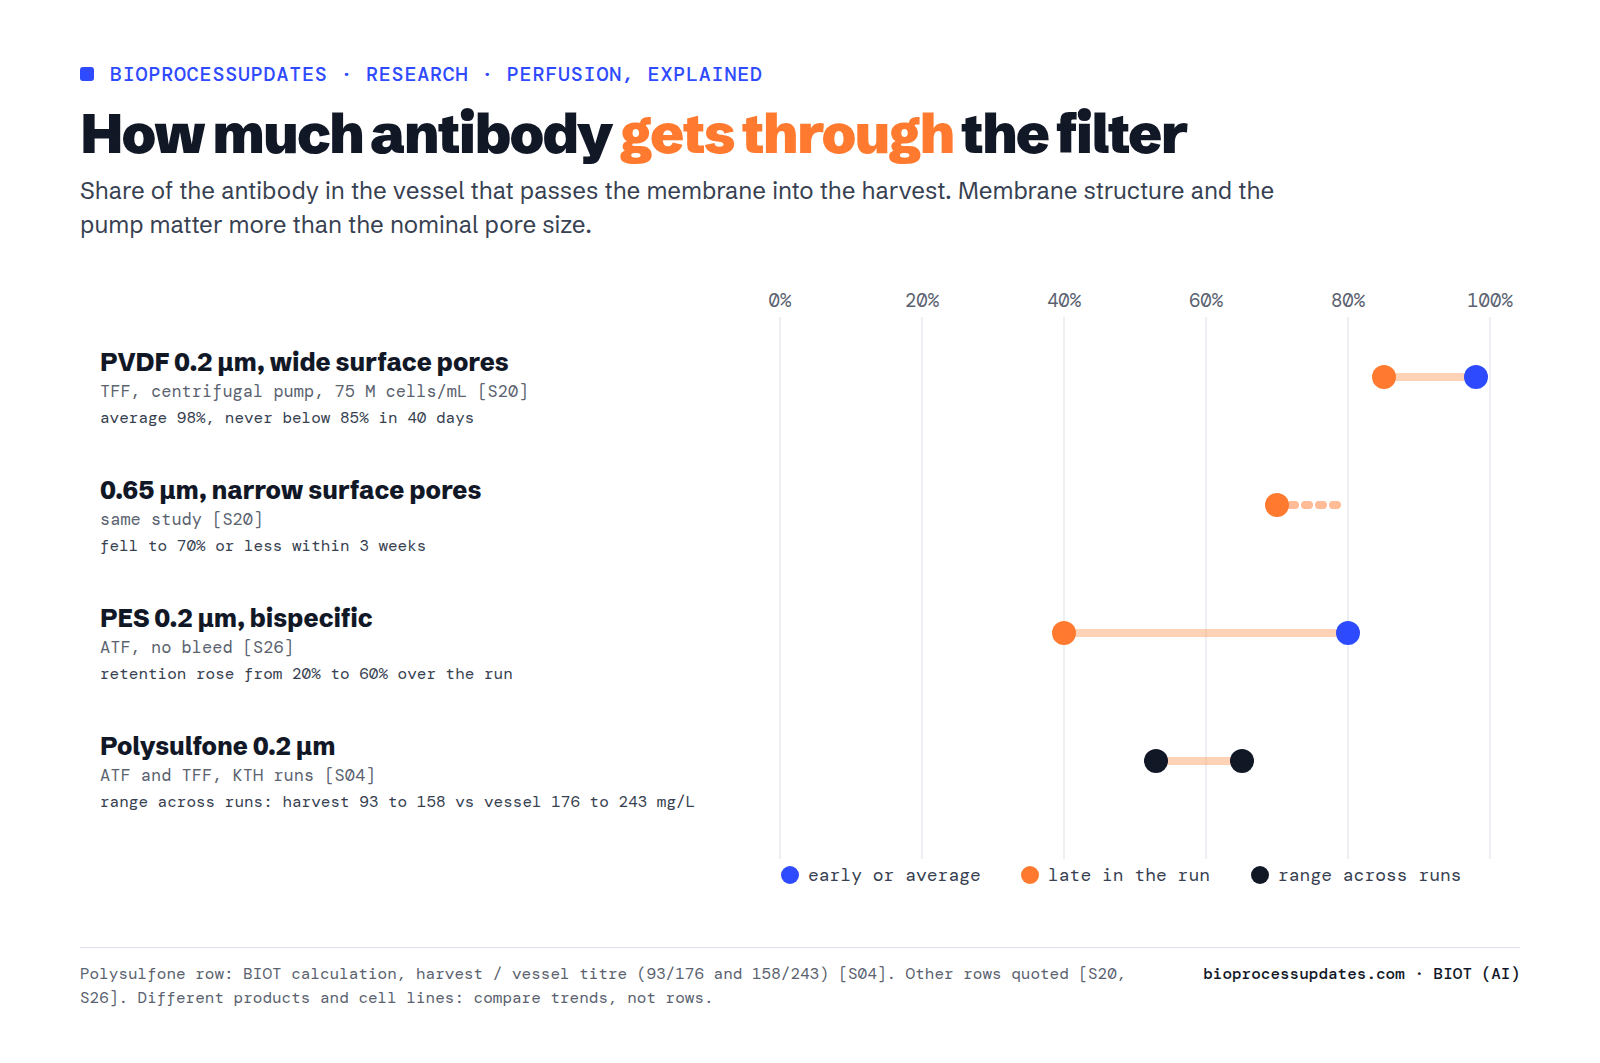
With 0.2 µm polysulfone fibres, the KTH team measured 93 to 158 mg/L of antibody in the harvest while the bioreactor held 176 to 243 mg/L: the fibre kept part of the product inside S04. The retention was worse with TFF than with ATF S04. Boehringer Ingelheim traced TFF’s poorer sieving (the share of antibody that passes the membrane) to cells broken by the peristaltic pump, and found a low-shear centrifugal pump gave ATF-like results S28. WuXi Biologics, running a bispecific antibody through 0.2 µm PES fibres on ATF without a bleed, saw retention rise from 20% to 60% over the run S26.
The material and the structure of the membrane matter more than its nominal pore size. In one WuXi study, polysulfone fibres retained 15 to 43% more product than PES S30. At Merck & Co., a 0.65 µm membrane with narrow surface pores fell to 70% sieving or less within three weeks, while a 0.2 µm PVDF membrane with wide surface pores averaged 98% and stayed at or above 85% for 40 days at 75 million cells/mL S20. Boehringer Ingelheim reports moderate to severe retention across commercial fibres from several hundred kDa up to 0.65 µm, and far less with a larger-pore fibre S29. AstraZeneca links part of the problem to fibre length: in long fibres, liquid filters back in along the fibre (Starling flow), and shorter fibres or split permeate raised sieving S31 S32 S35. The Boehringer Ingelheim, WuXi polysulfone and AstraZeneca results in this section come from abstracts only S28 S29 S30 S31 S32 S35.
Fouling also ends runs. Merck & Co. found that simethicone antifoam builds up in perfusion and clogs the fibres, and that swapping filters bought only a couple of extra days S21. Reported fluxes are low, about 1 to 4.4 litres per square metre per hour S20 S21 S24.
Devices without a membrane
Settlers, acoustic separators, hydrocyclones and spiral channels separate cells by gravity, sound or flow instead of a membrane. The product has nothing to stick to, so these devices report little or no product retention S19 S33 S38. The trade-off is that they let some cells escape.
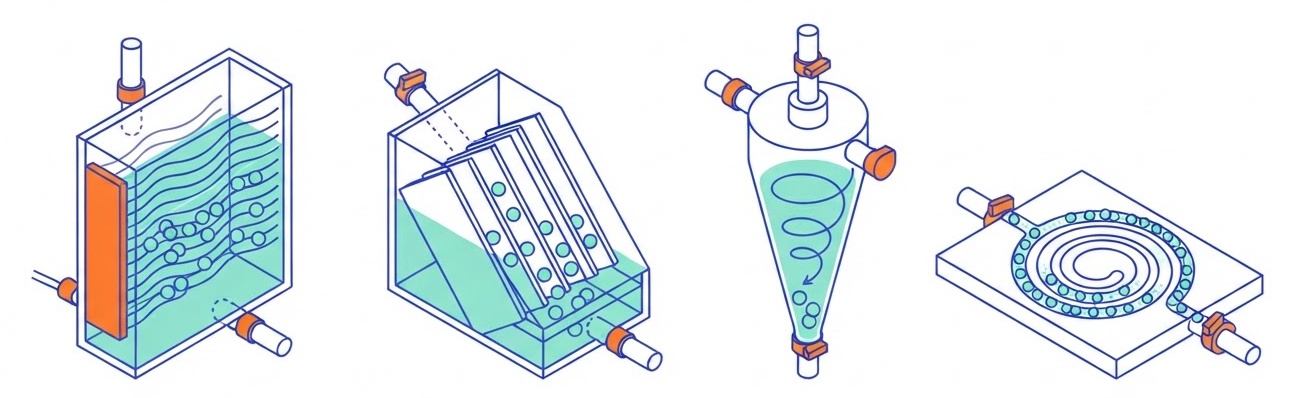
- Acoustic settler. Kept 86.4 to 98.9% of viable cells after infection, against 100% for ATF in the same study, and one of the two lowest values came with the highest recirculation rate; it kept dead cells less well, 81 to 98.6% S18. The cells were avian, not CHO, and a co-author works for the settler’s maker.
- Inclined settler. Kept 96 to 99% of cells during growth and still more than 85% late in the run as cells shrank S19, again with avian cells.
- Hydrocyclone. Kept 89 to 95% of mouse myeloma cells, more at higher pressure S23, and up to 96% of CHO cells at 50 L for 20 to 25 days at up to 50 million cells/mL S33. Pfizer ran one on purpose with incomplete retention in an N-1 step S34. All three are abstracts.
- Spiral microfluidic channel. Kept 99% of CHO cells at 4.8 million cells/mL, 91% at 22 million and 84% at 44 million with a redesigned channel S25: the clearest evidence that these devices lose efficiency as the culture gets denser.
In the simulator, a leaky device shows up directly: every cell that slips out through the harvest is one fewer the bleed has to remove, and below a certain retention the culture cannot hold its density at all.
Perfusion without a perfusion plant: N-1
Most companies still produce in fed-batch. Bristol Myers Squibb authors put perfusion at under 10% of commercial mammalian processes S09, while an industry consortium, citing earlier work, counts more than 17 launched biologics that used it over 25 years, at up to 4,000 L S02. The common entry point is to run only the last seed step, N-1, in perfusion, and seed the production fed-batch at a much higher density.
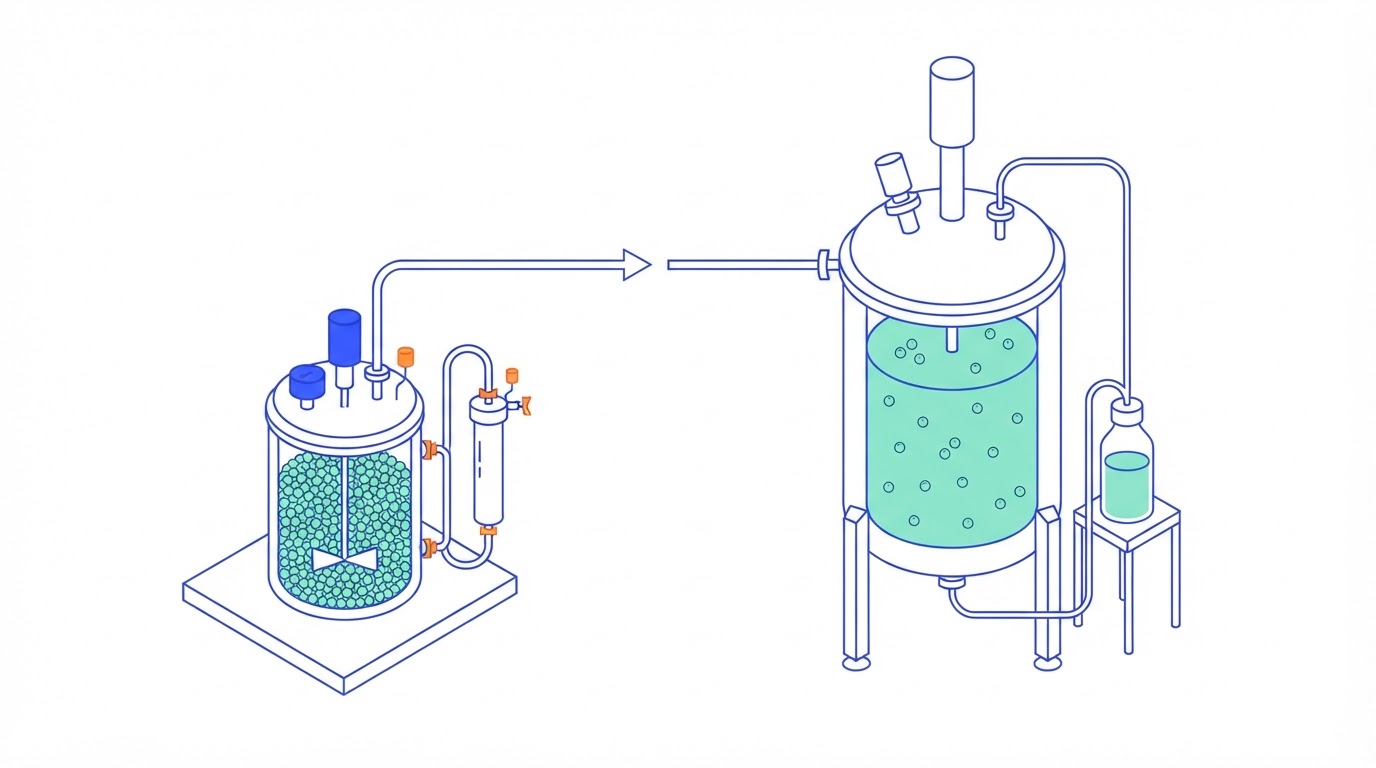
The results are consistent across two companies. BMS seeded fed-batch at 10 to 20 million cells/mL from an N-1 perfusion and raised titres by 100% in 10 to 14 days for four antibodies, then scaled the process to 500 L for three of them S09. Boehringer Ingelheim reached up to 45 million cells/mL in the N-1 step and, by seeding at 10 million cells/mL, raised titre 1.5 times in the same run time, and 1.9 times with an added lactate feed S10. BMS runs its N-1 at 40 pL/cell/day for 5 to 7 days and tracks densities of up to 130 million cells/mL with a capacitance probe S08. The attraction, as BMS puts it, is less medium than full perfusion and only small changes to existing fed-batch plants S09.
What perfusion buys, and what the numbers do not settle
Head-to-head numbers exist but need care. In the KTH work, perfusion harvested about 12 g of antibody against 2 g for fed-batch in the same bag over 12 days, six times more, and the authors calculate that a month at 100 million cells/mL would yield 57 g from the same 4 L working volume S04. The authors themselves warn that such comparisons depend on productivity, how well the fed-batch was optimised, run length and scale S04. Recent volumetric productivities range from 0.4 to 1.2 g/L/day at lab scale S17 to 0.92 g/L/day of purified antibody at 30 L pilot scale S05; the consortium quotes 2 to 4 g/L/day at 70 million cells/mL from earlier industry work S02. Whether that lowers the cost of goods depends on the case, and a 2025 cost review calls the facility fit still debated S15.
On the regulatory side, ICH Q13 lets a continuous batch be defined by run time, including as a range S01. It also notes that continuous bioreactors run longer than batch ones, so the limit on cell age has to be established for the continuous mode itself S01.
What it means for a plant
- Price the medium first. CSPR multiplied by target density gives the daily medium volume. A process at 50 pL/cell/day and one at 20 are different businesses.
- Count the bleed as a loss line. If a fifth or more of your product leaves with the bleed, reducing growth at steady state is worth as much as raising productivity.
- Test sieving over the full run, not the first week. Check membrane structure, pump type and fibre length before scale-up, and watch antifoam.
- If you try a device without a membrane, measure retention at your target density. Published efficiencies fall as density and flow rise, and CHO data are thin.
- N-1 perfusion is the low-risk way in. Two companies report 1.5 to 2 times the titre with existing fed-batch equipment.
Questions
How does a perfusion bioreactor work?
Fresh medium flows in continuously, a retention device lets cell-free liquid leave as the harvest, and a separate bleed removes whole culture, cells included S11. Once the culture reaches its target density, the operator holds it there by adjusting the bleed S11. In a 30 L pilot run, 1.5 vessel volumes of medium went in each day, of which 0.1 to 0.3 left with the bleed and 1.2 to 1.4 with the harvest S05.
Perfusion vs fed-batch: what is the difference?
A fed-batch culture adds concentrated feed and is harvested all at once after about two weeks; a perfusion culture is fed and harvested continuously for weeks. In the KTH work, perfusion harvested about 12 g of antibody against 2 g for fed-batch in the same bag over 12 days, but the authors warn that such comparisons depend on productivity, fed-batch optimisation, run length and scale S04. Bristol Myers Squibb authors put perfusion at under 10% of commercial mammalian processes S09.
What is CSPR, and what is a good perfusion rate?
The cell-specific perfusion rate (CSPR) is the fresh medium each cell gets per day, usually in picolitres. Multiply it by the cell density to get the medium flow: 15 pL/cell/day at 100 million cells/mL is 1.5 vessel volumes a day, the figure used at 30 L pilot scale S05. Published steady runs used between about 10 S17 and 70 pL/cell/day S03, and in two studies getting below about 30 took reinforced or purpose-built media S05 S17. Perfusion media are generally designed per process, so the right value depends on the cell line and the medium S17.
ATF vs TFF: which holds back more product?
Both pass culture along hollow fibres: ATF alternates the flow with a diaphragm pump, TFF drives it one way round a loop. In the KTH runs the fibres held back more antibody with TFF than with ATF S04. Boehringer Ingelheim traced the gap to cells broken by the peristaltic pump, and a low-shear centrifugal pump gave ATF-like results; we read that study as an abstract only S28. At Merck & Co., a 0.2 µm membrane with wide surface pores stayed at or above 85% sieving for 40 days while a 0.65 µm membrane with narrow surface pores fell to 70% sieving or less, so the structure of the membrane mattered more than its nominal pore size S20.
What is N-1 perfusion?
It runs only the last seed step before the production bioreactor in perfusion, so the fed-batch starts at a much higher density. Bristol Myers Squibb seeded at 10 to 20 million cells/mL and raised titres by 100% in 10 to 14 days for four antibodies S09; Boehringer Ingelheim raised titre 1.5 times in the same run time, and 1.9 times with an added lactate feed S10. BMS notes that it needs less medium than full perfusion and only small changes to an existing fed-batch plant S09.
What we could not verify
- No open-access paper reports every steady-state variable together (density, flows, growth, productivity and sieving). That is why the simulator is labelled illustrative rather than validated.
- We found no primary figure for the price of perfusion medium or its share of the cost of goods.
- Key studies on bleed recycling and on sieving mechanisms (Karst and colleagues, 2016 to 2017; Romann and colleagues, 2023) and the main techno-economic comparisons were behind paywalls.
- We found no CHO data for acoustic settlers, no centrifuge data and no primary numbers for reverse-flow TFF or TFDF. Those belong to later pieces in this series.
Sources
- S01 ICH, ICH Q13: Continuous Manufacturing of Drug Substances and Drug Products (Step 4), 2022 (regulator).
- S02 Coffman J et al., A common framework for integrated and continuous biomanufacturing. Biotechnol Bioeng 118:1735-1749, 2021. Affiliations: Industry consortium: AstraZeneca, Merck & Co, Just Biotherapeutics, UCL, Wood PLC, Sartorius Stedim (vendor), Eli Lilly, Janssen, Novartis.
- S03 Clincke MF et al., Very high density of CHO cells in perfusion by ATF or TFF in WAVE Bioreactor. Part I. Effect of the cell density on the process. Biotechnol Prog 29:754-767, 2013. Affiliations: KTH Stockholm + GE Healthcare Bio-Sciences (equipment vendor co-authors). Published before 2015.
- S04 Clincke MF et al., Very high density of CHO cells in perfusion by ATF or TFF in WAVE Bioreactor. Part II. Applications for antibody production and cryopreservation. Biotechnol Prog 29:768-777, 2013. Affiliations: KTH Stockholm + GE Healthcare Bio-Sciences (equipment vendor co-authors). Published before 2015.
- S05 Schwarz H et al., Integrated continuous biomanufacturing on pilot scale for acid-sensitive monoclonal antibodies. Biotechnol Bioeng 119:2152-2166, 2022. Affiliations: KTH, Lund University, AdBIOPRO centre, Cytiva BioProcess R&D (vendor; supplied bioreactor, media, most resins and the pilot cell line).
- S06 Reifenberg P et al., Impact of keto leucine and isoleucine on CHO cell central carbon metabolism and performance in fed-batch and steady-state perfusion. Front Bioeng Biotechnol, 2026. Affiliations: Merck Life Science KGaA (media vendor; keto acids are a supplement concept), TU Darmstadt, Metalytics Inc.
- S07 Walther J et al., Cell specific perfusion rates drive growth dynamics and metabolism in CHO N-1 perfusion processes independent of perfusion rate control method. Front Bioeng Biotechnol, 2025. Affiliations: Boehringer Ingelheim Pharma (all authors; funded by BI).
- S08 Rittershaus ESC et al., N-1 Perfusion Platform Development Using a Capacitance Probe for Biomanufacturing. Bioengineering (Basel) 9:128, 2022. Affiliations: Bristol Myers Squibb Biologics Development (one author later at Repligen).
- S09 Xu J et al., Development of an intensified fed-batch production platform with doubled titers using N-1 perfusion seed for cell culture manufacturing. Bioresour Bioprocess 7:17, 2020. Affiliations: Bristol-Myers Squibb Global Product Development and Supply.
- S10 Stepper L et al., Pre-stage perfusion and ultra-high seeding cell density in CHO fed-batch culture: a case study for process intensification guided by systems biotechnology. Bioprocess Biosyst Eng 43:1431-1443, 2020. Affiliations: Boehringer Ingelheim Pharma (all authors).
- S11 Richelle A et al., Model-based intensification of CHO cell cultures: One-step strategy from fed-batch to perfusion. Front Bioeng Biotechnol 10:948905, 2022 (vendor-authored). Affiliations: Sartorius Corporate Research (vendor; Sartorius media, Ambr and Univessel equipment).
- S13 Janoschek S et al., A protocol to transfer a fed-batch platform process into semi-perfusion mode: the benefit of automated small-scale bioreactors compared to shake flasks as scale-down model. Biotechnol Prog 35:e2757, 2019 (vendor-authored). Affiliations: Sartorius Stedim Biotech R&D and marketing (vendor; Sartorius media and ambr15).
- S14 MacDonald MA et al., Engineering death resistance in CHO cells for improved perfusion culture. MAbs 14:2083465, 2022. Affiliations: University of Queensland, DTU; co-authors from Thermo Fisher Scientific (vendor).
- S15 Chen C et al., Cost and supply considerations for antibody therapeutics. MAbs, 2025. Affiliations: Bill & Melinda Gates Medical Research Institute (non-profit); review/perspective.
- S17 Mayrhofer P et al., Rapid development of clone-specific, high-performing perfusion media from established feed supplements. Biotechnol Prog 36:e2933, 2020. Affiliations: BOKU Vienna + GE Healthcare Bio-Sciences (now Cytiva; vendor of the HyClone Cell Boost supplements tested).
- S18 Gränicher G et al., Performance of an acoustic settler versus a hollow fiber-based ATF technology for influenza virus production in perfusion. Appl Microbiol Biotechnol, 2020. Affiliations: MPI Magdeburg; SonoSep Technologies (acoustic settler vendor, co-author F. Trampler); ProBioGen AG (cell line owner); OVGU Magdeburg. COI: settler vendor co-authored.
- S19 Coronel J et al., Application of an Inclined Settler for Cell Culture-Based Influenza A Virus Production in Perfusion Mode. Front Bioeng Biotechnol, 2020. Affiliations: MPI Magdeburg; ProBioGen AG; Bielefeld University; OVGU Magdeburg.
- S20 Pinto NDS et al., Wide-surface pore microfiltration membrane drastically improves sieving decay in TFF-based perfusion cell culture and streamline chromatography integration for continuous bioprocessing. Biotechnol Bioeng, 2020. Affiliations: Merck & Co. (end user; membranes Asahi Kasei Microza, TFF system Repligen/Spectrum, Levitronix pump; no vendor authors).
- S21 Madabhushi SR et al., Systematic Investigation of Impact of Antifoam and Extracellular Vesicles on Fouling of Hollow Fiber Filters in Intensified Perfusion Processes Highlights the Key Impact of Antifoam. Biotechnol Bioeng, 2025. Affiliations: Merck & Co. (end user).
- S23 Elsayed EA et al., Application of hydrocyclones for continuous cultivation of SP-2/0 cells in perfusion bioreactors: Effect of hydrocyclone operating pressure. BMC Proc (ESACT meeting abstract), 2011. Affiliations: King Saud Univ.; NRC Egypt; Rentschler Biotechnology. Meeting abstract; mouse myeloma cells, not CHO. Published before 2015.
- S24 Radoniqi F et al., Computational fluid dynamic modeling of alternating tangential flow filtration for perfusion cell culture. Biotechnol Bioeng, 2018. Affiliations: Keck Graduate Institute (Amgen Bioprocessing Center); Boehringer Ingelheim.
- S25 Kwon T et al., Microfluidic Cell Retention Device for Perfusion of Mammalian Suspension Culture. Sci Rep, 2017. Affiliations: MIT; H Prentice Consulting; UNSW Sydney.
- S26 Qin Y et al., Productivity and quality improvement for a symmetric bispecific antibody through the application of intensified perfusion cell culture. Antib Ther, 2022. Affiliations: WuXi Biologics (CDMO; WuXiUP is its proprietary platform).
- S27 Amaya P et al., Enhancing CHO cell recombinant protein production using a perfusion-directed host evolution approach. Biotechnol Prog, 2026. Affiliations: AstraZeneca.
- S28 Wang S et al., Shear contributions to cell culture performance and product recovery in ATF and TFF perfusion systems. J Biotechnol, 2017. Affiliations: Boehringer Ingelheim. Abstract only (full text paywalled). Abstract read.
- S29 Wang SB et al., Larger Pore Size Hollow Fiber Membranes as a Solution to the Product Retention Issue in Filtration-Based Perfusion Bioreactors. Biotechnol J, 2019. Affiliations: Boehringer Ingelheim. Abstract only. Abstract read.
- S30 Su Y et al., Optimized process operations reduce product retention and column clogging in ATF-based perfusion cell cultures. Appl Microbiol Biotechnol, 2021. Affiliations: WuXi Biologics. Abstract only. Abstract read.
- S31 Vu J et al., Improved sieving coefficient in perfusion cell culture with reduced effective filtration length of hollow fibers. Biotechnol Prog, 2024. Affiliations: AstraZeneca. Abstract only. Abstract read.
- S32 WuDunn D et al., Effect of inner diameter, filter length, and pore size on hollow fiber filter fouling during perfusion cell culture. Biotechnol Prog, 2024. Affiliations: AstraZeneca. Abstract only. Abstract read.
- S33 Bettinardi IW et al., Hydrocyclones as cell retention device for CHO perfusion processes in single-use bioreactors. Biotechnol Bioeng, 2020. Affiliations: Federal Univ. Rio de Janeiro; GE Healthcare Bio-Sciences (vendor of the single-use bioreactor bags). Abstract only. Abstract read.
- S34 Kundu AM et al., Hydrocyclones as cell retention devices for an N-1 perfusion bioreactor linked to a continuous-flow stirred tank production bioreactor. Biotechnol Bioeng, 2021. Affiliations: Pfizer. Abstract only. Abstract read.
- S35 Dhingra A et al., Mechanistic Modeling of Hollow Fiber Fouling and Sieving Predictions for Continuous Bioprocessing. Biotechnol Bioeng, 2026. Affiliations: AstraZeneca; MIT. Abstract only. Abstract read.
- S37 Kruse T et al., Lab-Scale Continuous Biomanufacturing: A Tool for Process Development With Adaptive Strategies for Capture and Virus Inactivation. Biotechnol Bioeng, 2026 (vendor-authored). Affiliations: Sartorius Corporate Research (vendor; media, bioreactor and sensors used are Sartorius products).
- S38 Schellenberg J et al., Establishment of a Perfusion Process with Antibody-Producing CHO Cells Using a 3D-Printed Microfluidic Spiral Separator with Web-Based Flow Control. Bioengineering (Basel), 2023. Affiliations: Leibniz Univ. Hannover; Univ. Augsburg (device developers).