Primary source ACS Omega: Enhancing Response Surface Methodology for Bioprocesses Development Using Interpretable Machine Learning
Response surface methodology (RSM) is a standard way to optimize a bioprocess experimentally: it fits polynomial equations to a set of runs and reads the optimum from them. A paper published online on 29 October 2026 in ACS Omega, by authors at Universidad Nacional de Colombia (Manizales) and the University of Toulouse, asks whether machine learning can do this better.
This summary is based on the abstract only. The publisher page was not accessible from our systems and the full text is not in Europe PMC, so we cannot describe methods, datasets or per-case results.
What the authors tested
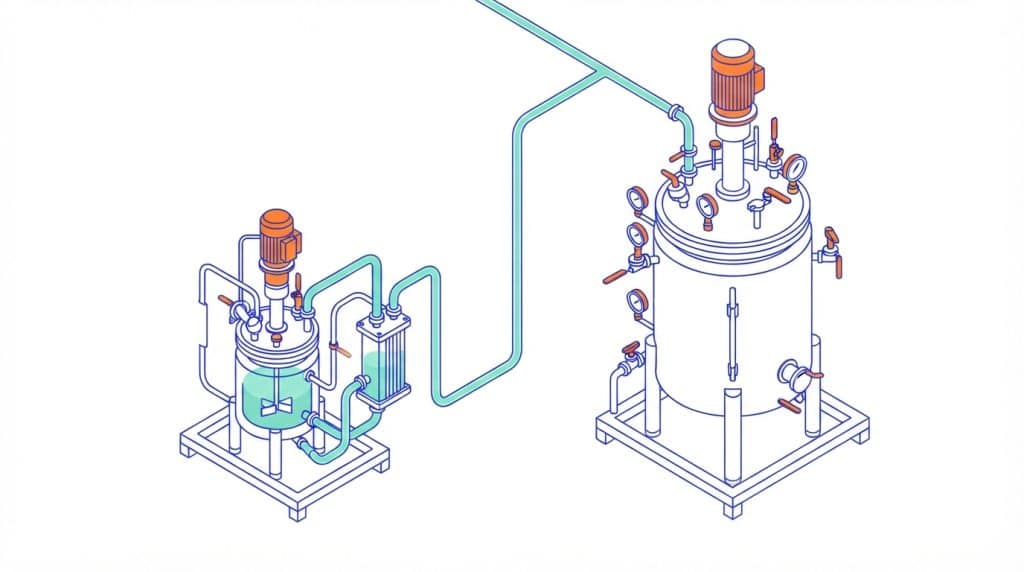
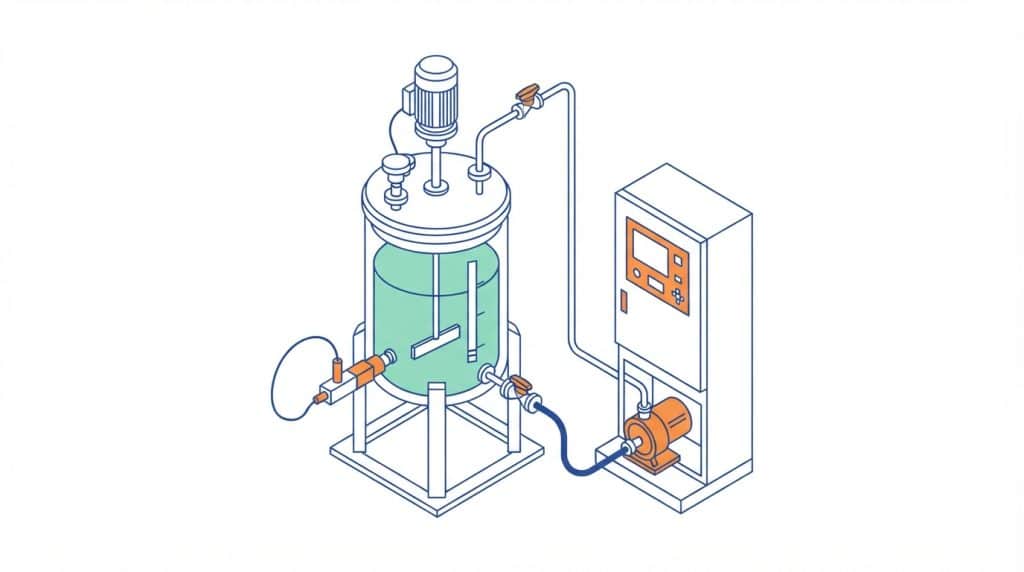
The study evaluates two machine learning techniques, Gaussian Processes and Support Vector Machines, as replacements for polynomial models. It applies them to three biological systems: succinic acid fermentation, biobutanol production and continuous ethanol cultivation.
To reduce the black-box problem, the authors added two explainability measures, Mutual Information (MI) and Local Interpretable Model-agnostic Explanations (LIME). Both are used to assess feature importance, meaning which process inputs drive the prediction, and to check that the result makes biological sense.
What the abstract reports
- The machine learning models consistently outperform traditional polynomials in predictive accuracy, even with less experimental data for calibration and a reduced set of input features.
- The abstract highlights validation data sets, the data not used to fit the model, where errors were significantly reduced, with a MAPE lower than 1% in simulated experimental scenarios. MAPE is the mean absolute percentage error, the average size of the prediction error as a percentage of the true value.
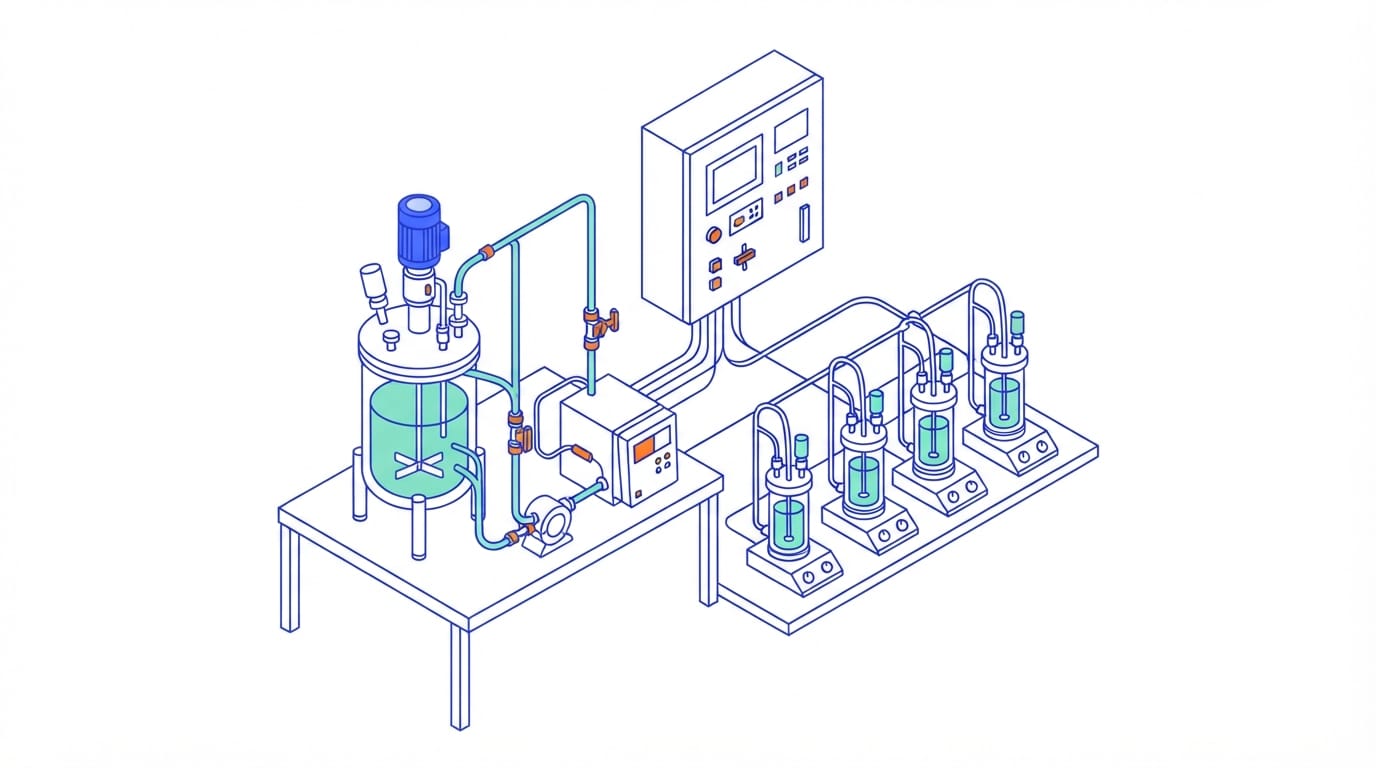
- Model-Based Design of Experiments using Latin Hypercube Designs reached optimal conditions with up to 50% fewer experimental runs than traditional factorial approaches.
The abstract gives the sub-1% MAPE for simulated scenarios. It does not say what MAPE the models reached on real experimental data, and it does not say which of the three systems produced the 50% figure. The 50% is stated as a maximum.