The FDA published its framework for process analytical technology, PAT, in 2004 S01. In a plant the questions are now practical ones: which probes measure what they claim, how much work a model takes, why models stop working, and what is worth doing first. We read 43 primary sources, from the regulators’ own texts to studies by Takeda, Bristol Myers Squibb, Janssen, Biogen and the vendors themselves, to see what has actually been measured. Two shorter pieces cover part of the same ground: why Raman models break across scales, and what two reviews say is already digital and what is still manual.
The seven findings in short
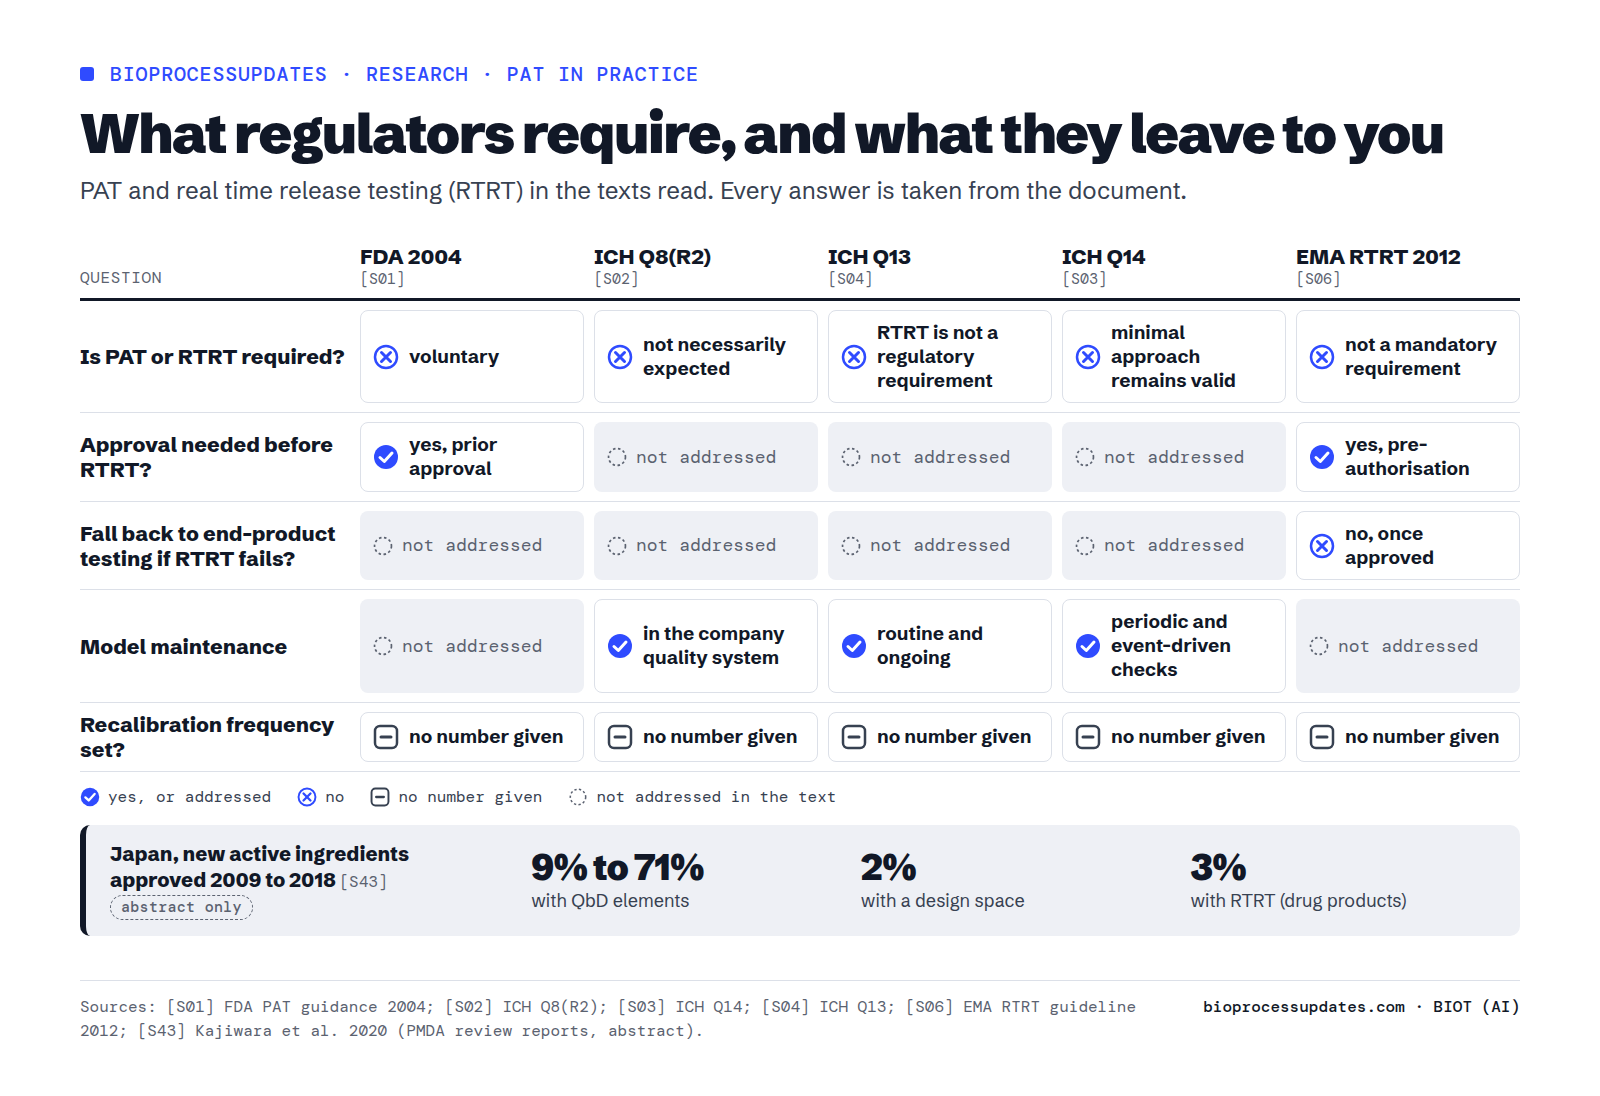
- PAT is optional everywhere, and no regulator sets a recalibration interval. The FDA calls it voluntary. ICH Q8(R2), Q13 and Q14 and the EMA say that real time release testing, or the enhanced approach, is not required. Keeping models working is left to the company’s own risk assessment and quality system. Confidence: high, these are the texts themselves.
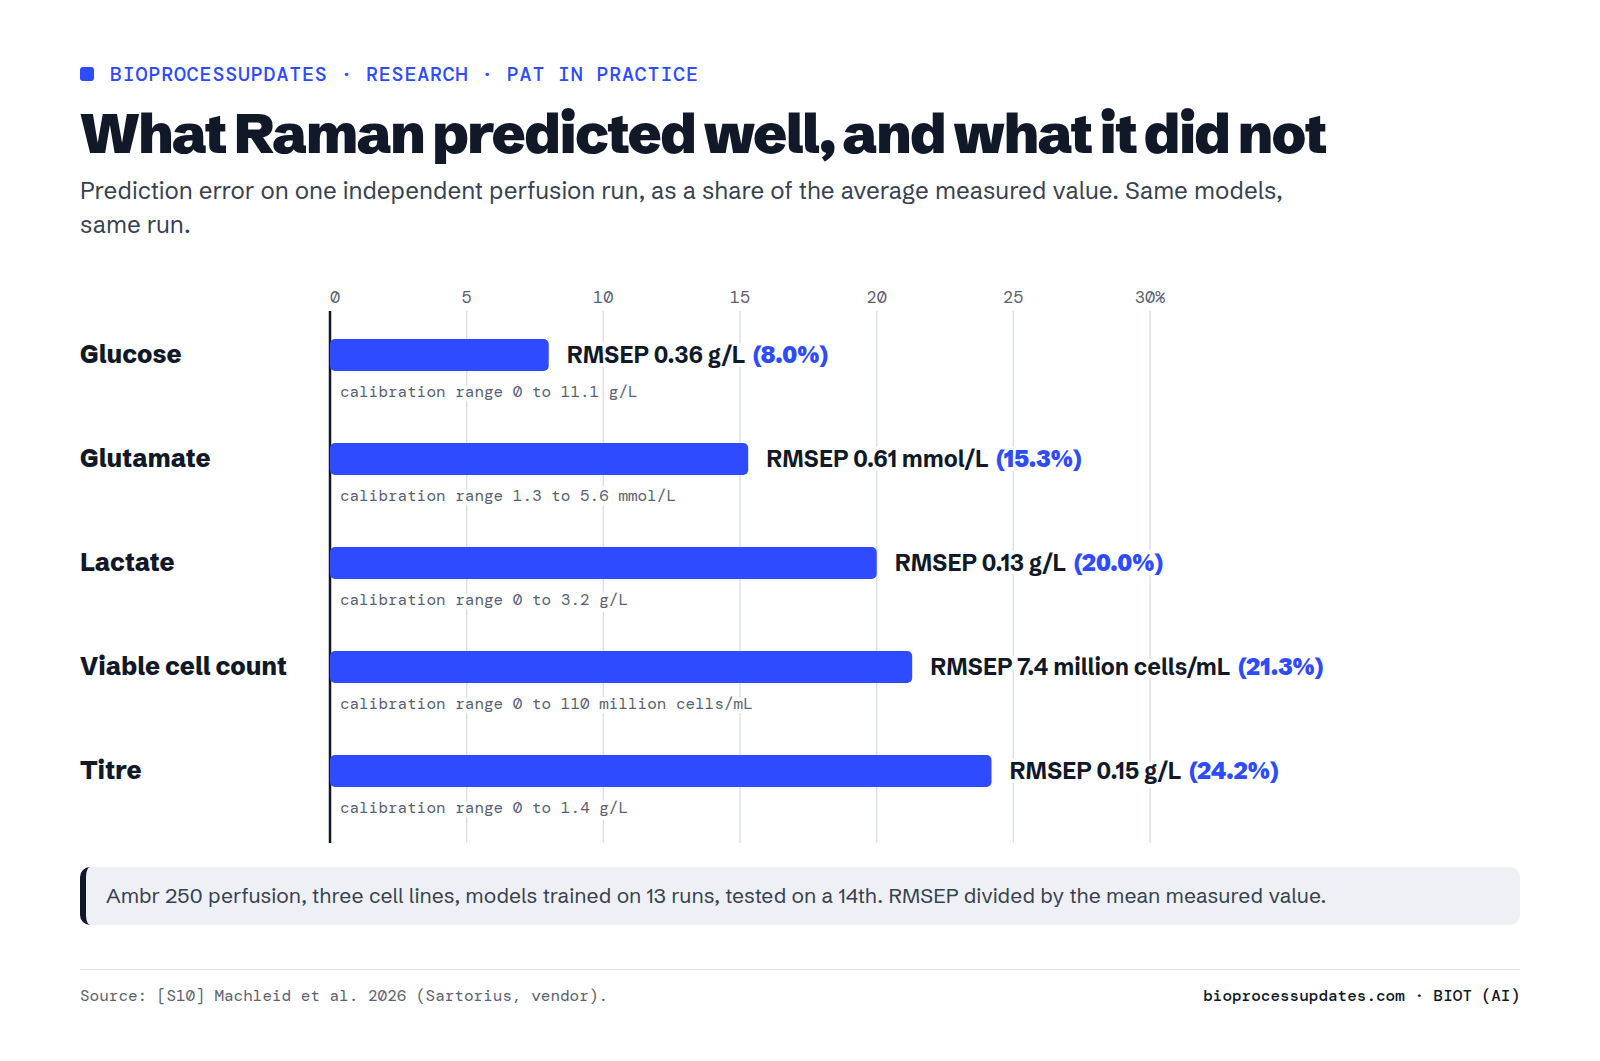
- Raman tracks glucose reliably. Product titre and cell counts are where the models struggle. Three groups report Raman glucose errors of 0.20 to 0.44 g/L. In one vendor study the titre and cell count errors were 21 to 24% of their average value, against 8% for glucose. Confidence: medium to high for glucose, low for titre and cells.
- Models break when something changes. A new cell line raised a titre error about six fold at Takeda. Models moved from 250 mL vessels to 5 L lost accuracy for viability and glutamine. Adding one plant batch improved a Janssen glycosylation model by 77.5%. Confidence: medium.
- Glucose control from the Raman reading is the best documented payoff. Biogen, Janssen and AstraZeneca report less glycation of their products than with bolus feeding. Confidence: medium; the direction agrees, but all three results were read as abstracts.
- Capacitance counts living cells well while they grow, and drifts once they stop growing and swell. R2 of 0.99 at 50 to 2,000 L in growth. In one run, after day 8 the usual single-frequency model was off by 21% on average, against 7% for a multifrequency model. Confidence: high.
- Calibration is the hidden cost. The models in the studies we read drew on five to 44 cultures, and one paper describes the conventional workflow as taking up to six months. Shortcuts came close in single studies. Confidence: low to medium.
- Cost and payback are not published. We found one measured saving, 25% less medium, and one review’s price estimates for instruments. Nothing on labour saved, batches rescued or payback time. Confidence: low.
How we built this
We read 29 sources in full and 14 from the abstract only, and we say so where it matters. Eight are regulator documents: the FDA guidance of 2004, ICH Q8(R2), Q13, Q14 and Q2(R2), an ICH implementation paper of 2011, the EMA guideline on real time release testing of 2012 and the EMA reflection paper on AI of 2024 S01 S02 S03 S04 S05 S06 S07 S08. Who is talking matters here. Sartorius, which makes the bioreactors, the Raman flow cells and the software used in its studies, is the author of four of the papers S09 S10 S16 S18. Equipment makers co-authored four more: the analyser makers IRUBIS S21 and Thermo Fisher S22, the bioreactor maker Bionet S26 and the probe maker Hamilton S40; the pump maker Levitronix co-authored a fifth S15. Most of the rest come from drug makers and contract manufacturers writing about their own processes: Takeda S11, Daiichi Sankyo S12, GC Biopharma S13, Merck KGaA with FHNW S15, Bristol Myers Squibb S17, Gedeon Richter S20, Lonza S30, Amgen S31, Biogen S32 S37, Janssen S33 S35, AstraZeneca S34, BioRay S36, WuXi Biologics S39 and Johnson & Johnson S42. Several of the company results, including all three glucose control studies with product quality data, we could read only as abstracts, so the scale and the number of runs behind them are unknown. Almost every accuracy figure comes from development bioreactors of 250 mL to 15 L. The papers report errors in different ways, some divided by the mean, some by the range, some not at all, so the numbers below cannot be used to rank one tool against another.
What regulators ask for, and what they do not
The FDA guidance set PAT up as a framework to “encourage the voluntary development and implementation” of new ways of developing, making and testing medicines S01. Working with the agency on PAT is “a voluntary one”, and doing it for one product does not mean doing it for others S01. The guidance groups the tools in four families: multivariate tools for design, data acquisition and analysis; process analysers; process control tools; and tools for continuous improvement and knowledge management S01. It also defines the words used later in this piece. On-line means the sample is diverted from the process and may be returned; in-line means it never leaves the process stream S01. And it notes that a process analyser need not give an absolute value of the attribute S01.
The later texts keep the same line. ICH Q8(R2) defines PAT as designing, analysing and controlling manufacturing through timely measurements of critical quality and performance attributes, and says that even in the enhanced approach a design space or real time release testing is “not necesserily expected” (the spelling is the guideline’s) S02. ICH Q14, adopted in 2023, says the minimal approach to developing an analytical procedure “remains a valid approach” S03. ICH Q13 says real time release testing “is not a regulatory requirement” for continuous manufacturing S04. The EMA guideline of 2012 welcomes the knowledge it brings, “however it is not a mandatory requirement” S06.
Real time release testing, RTRT, is the step that changes the rules. It means judging the quality of a batch from process data S01, and the FDA traces it back to the parametric release of heat sterilised products, practised in the United States since 1985 S01. It needs approval before it is used: from the FDA S01, and in the EU a pre-authorisation, with a variation needed to go back to end-product testing S06. Once it is approved in the EU, a failing result cannot be replaced by an end-product test S06. The EMA expects comparative data at commercial scale where applicable, and a contingency plan for when the equipment fails S06. RTRT replaces end-product testing but not the review of the batch that GMP requires before release S02. For therapeutic proteins, ICH Q13 lists in-line pH, osmolality and protein concentration, and online purity, charge variants and aggregation, as possible examples S04, while potency still needs a conventional test S04.
On models, the texts describe a process and leave the numbers to the company. An ICH paper of 2011 sorts models by impact: a chemometric model for product assay is high impact, and a calibration model becomes high impact when its method is used for release testing; low-impact models “typically do not call for verification” S05. ICH Q14 splits a multivariate model’s life into establishment, routine use and maintenance S03. It asks for periodic and event-driven checks against reference results, with triggers such as new process variability, unexpected events or scheduled instrument maintenance S03, outlier diagnostics in routine use S03, and recalibration that can add new data and drop old data S03. ICH Q13 asks for model maintenance “on a routine and ongoing basis” during commercial manufacture, warns that a model may have to be redeveloped and revalidated S04, and, where real time release testing is used, asks companies to assess what happens to their decisions while a probe is being recalibrated S04. The EMA reflection paper on AI asks for performance monitoring with defined thresholds so that drift is caught early S08, and for high-impact uses it asks for a new evaluation after non-trivial changes to the hardware or software S08. None of these texts gives a recalibration frequency or a numeric accuracy target. The ICH paper leaves the frequency of comparison with the reference method, the triggers for updates and the handling of out-of-specification predictions to the company’s quality system S05.
The FDA text also leaves room to experiment. A site can try an experimental in-line or on-line analyser in production under its own quality system, after a risk analysis, without notifying the agency, and the data count as research data S01 that the FDA “does not intend to inspect” for that purpose S01.
The toolbox, and how well each tool measured
Raman spectroscopy has by far the most published data, and the next three sections are about it. The other tools have fewer studies, often a single one each.
Near infrared (NIR). Gedeon Richter and the Budapest University of Technology followed one antibody process with an on-line NIR probe from a 1 L shake flask through 20, 100 and 1,000 L to 5,000 L stainless steel bioreactors S20. Their best glucose model, built on 20 and 100 L data, predicted five 5,000 L runs with an error of 4.18 mM on a 29 mM range S20, about 0.75 g/L by our calculation. The authors set their own target at no more than 5 mM S20. Glucose is hard for NIR because its concentration is low, usually below 40 mM, and keeps changing S20, and shake flask spectra differed so much from bioreactor spectra that they did not help S20.
Mid infrared (MIR). IRUBIS, which makes the analyser, and Amgen measured glucose and lactate in 22 perfusion runs at 2 and 10 L with a one-point calibration: errors of 0.29 g/L for glucose and 0.24 g/L for lactate S21. Conventional models built from 206 samples did about as well, 0.41 and 0.16 g/L S21.
Off-gas analysis. A mass spectrometer on the exhaust gas of CHO fed-batch cultures at 5 and 50 L, in a study co-authored by its maker, Thermo Fisher, gave an inlet oxygen signal that tracked the viable cell count with an R2 of about 0.9 S22. The respiratory quotient was above 1 while the cells produced lactate and below 1 while they consumed it S22. The authors point out that mammalian cells respire so little that the analyser needs very high short-term precision S22. In a 5 L run it flagged a clogged exhaust filter overnight, and the culture was recovered once the filter was replaced; in the 50 L run it registered losses of compressed air that did not show in the dissolved oxygen reading S22.
Optical density. For high-density yeast cultures, University College Dublin and the Spanish bioreactor maker Bionet converted an 860 nm probe signal to dry cell weight with cross-validated R2 of 0.85 to 0.91 over 19 batches of three species S26. They write that such probes are already fitted to a large fraction of industrial bioreactors S26, without a figure.
What we found no data for. We found no primary study with numbers for 2D fluorescence or for online HPLC with automated sampling. A Sartorius paper argues that 2D fluorescence can see glucose only through its correlation with other compounds, because glucose does not fluoresce S09; Sartorius sells Raman equipment. A 2026 review, citing earlier work, says automated samplers are not widely accepted in biopharma, mainly because of GMP concerns S29.
Raman: glucose yes, titre and cells less so
In a Sartorius study, a Raman flow cell sat on the cell-free harvest line of a CHO perfusion culture. A glucose model built from five cultivations predicted a sixth with an error of 0.23 g/L S09. No valid lactate model could be built from the same runs (R2 0.267) S09: lactate varied over a narrow range, and the authors cite earlier trials showing that a model needs a concentration range of at least ten times its error S09.
A second Sartorius study is the clearest side-by-side we found, because it tested all its models on the same independent run. Calibrated on 13 Ambr 250 perfusion cultures across three cell lines, the models predicted a fourteenth culture with errors of 8.0% of the average value for glucose, 20.0% for lactate, 15.3% for glutamate, 21.3% for the viable cell count and 24.2% for titre S10. The authors call the models good to excellent S10. Our reading is narrower: glucose is accurate, while titre and cell counts are a trend rather than a measurement. Titre was also calibrated over a low range only, 0 to 1.4 g/L, because perfusion keeps removing it S10.
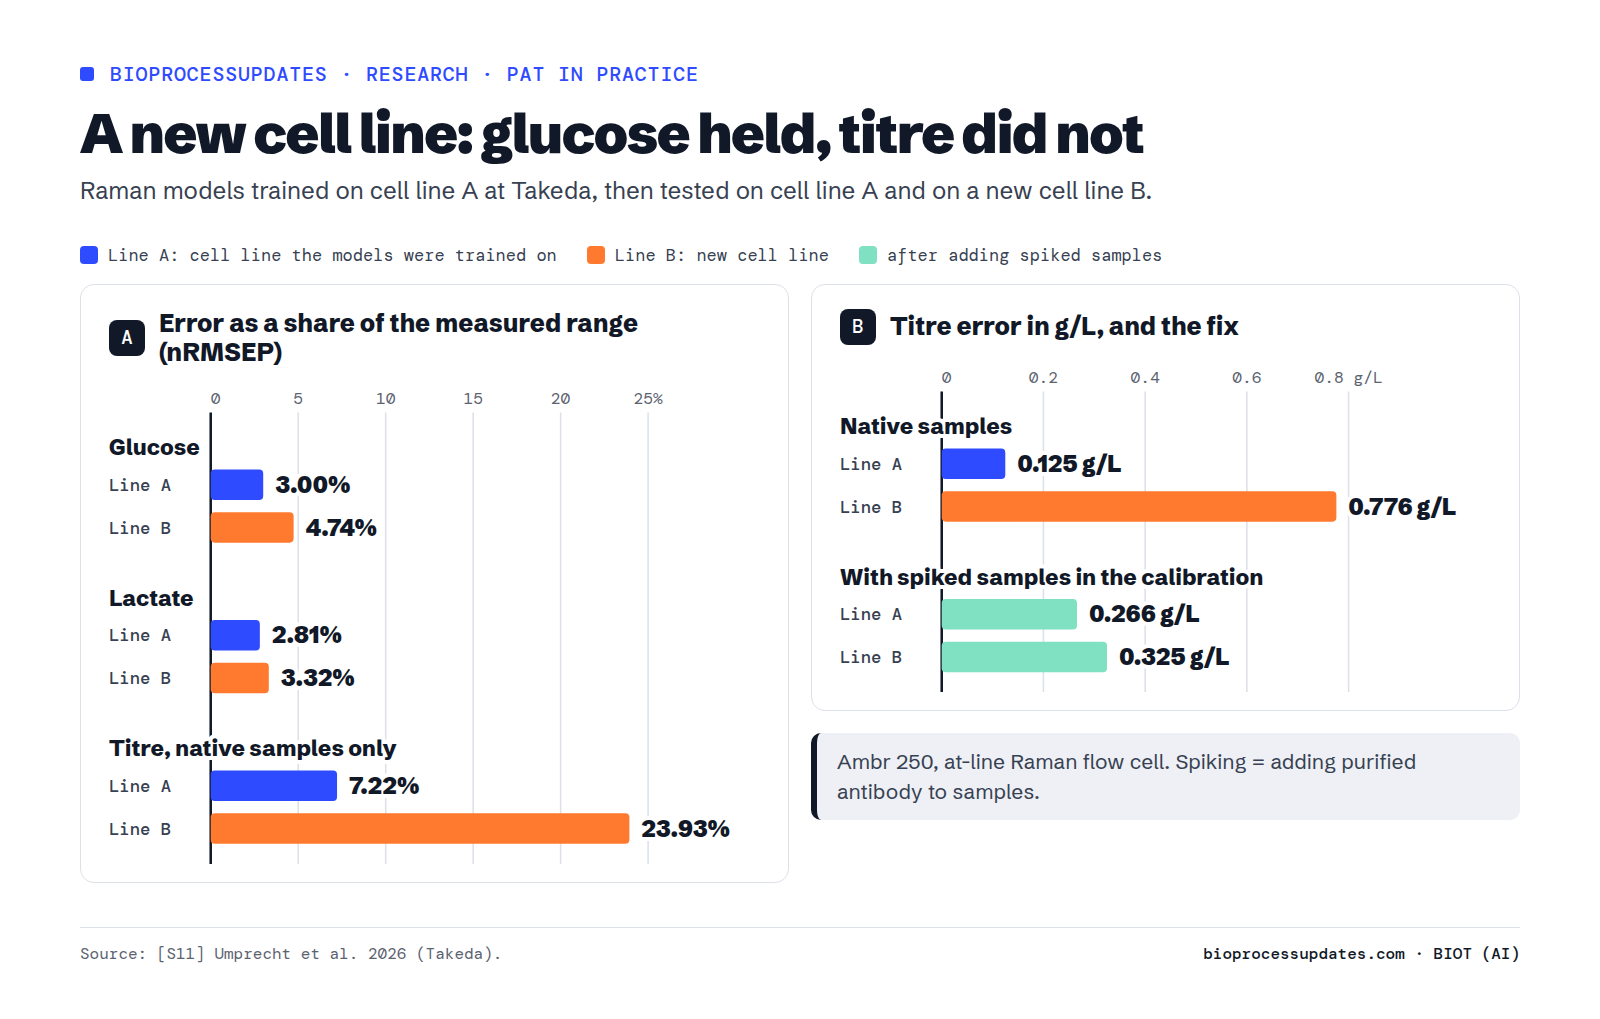
Other groups report similar glucose errors. Takeda’s glucose model had a normalised error of 3.00% of the range on its own cell line S11. Lonza’s generic models, built across two cell lines, gave average errors of 0.44 g/L for glucose, 0.23 g/L for lactate, 0.03 g/L for ammonium and 1.90 million cells/mL for the viable cell count S30; we read that study as an abstract.
At manufacturing scale the evidence is thinner and comes from abstracts. BioRay pooled in-line spectra from four commercial 1,500 L processes into one model, with R2 above 0.94 for glucose, lactate and viable cell density; a fifth process it had not seen “demonstrated the applicability limits” of that model S36. Janssen built seven Raman models for glycation and glycosylation at 5 L and took them to 2,000 L; the abstract gives no accuracy figures S35.
One study shows how far a model can go on correlation alone. Daiichi Sankyo built Raman models for over 100 components from six Ambr 250 reactors, with an average R2 of 0.62 S12. It also reports accurate models for things Raman cannot detect, such as metal ions, oxygen and carbon dioxide, and explains them as indirect: those values correlated with compounds that Raman does see S12. Our reading: a model like that works only as long as the correlation holds. The FDA guidance already noted that, depending on risk, a simple correlation may need further support, such as a mechanistic explanation S01, and an FHNW and Merck KGaA study warns that without spiking a model may look predictive without being robust S15.
Closing the loop on glucose
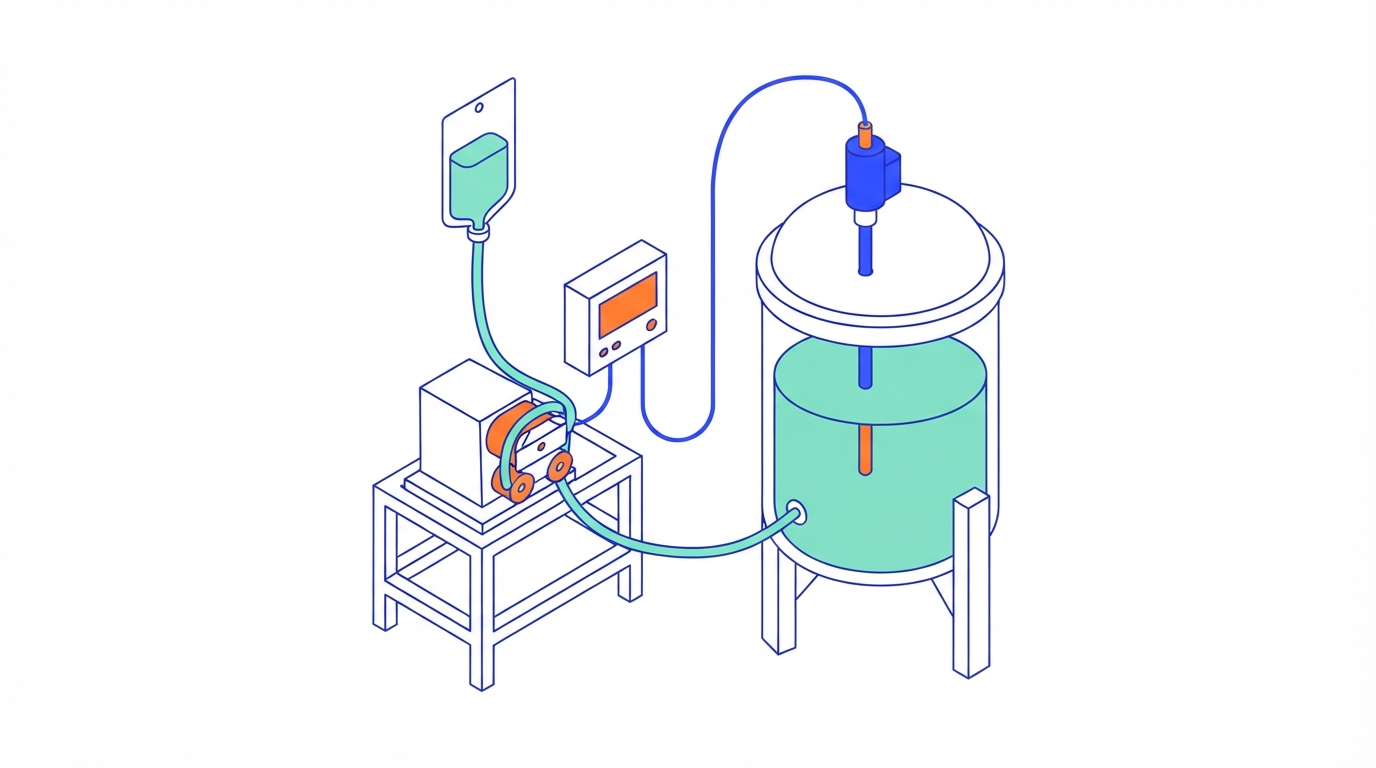
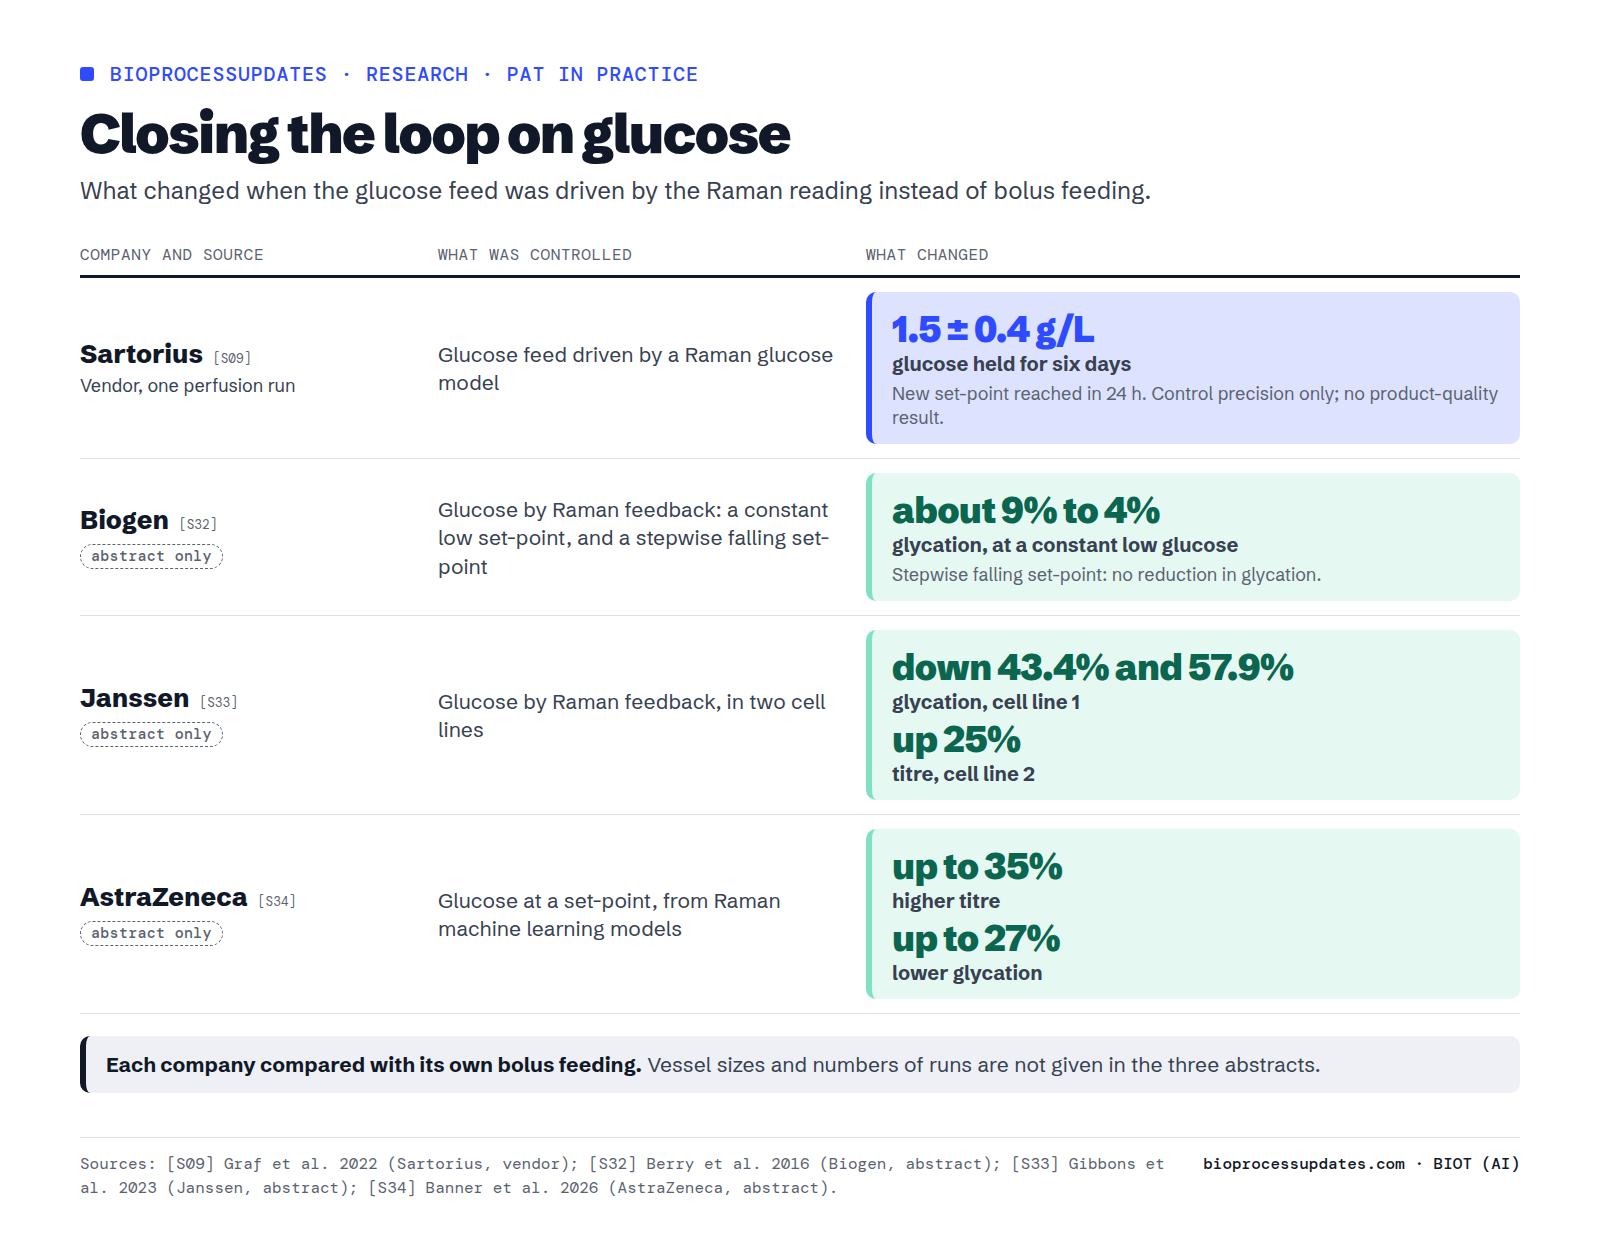
The use of Raman with the clearest published payoff is to drive the glucose feed from the measurement. In the Sartorius perfusion study, a controller on the feed pump held glucose at 4 g/L and then at 1.5 g/L, with a variability of plus or minus 0.4 g/L S09. The lower set-point was reached in 24 hours and held for the remaining six days S09. At 1.5 g/L that band is plus or minus 27% of the target, by our calculation.
The product quality results come from three drug makers, all read as abstracts. Biogen held glucose at a constant low level and cut antibody glycation from about 9% to 4%; a set-point that stepped down over time gave no reduction against its historical bolus feeding S32. Janssen reported glycation down by 43.4% and 57.9% in batches of one cell line, and a 25% higher titre with better growth in another S33. AstraZeneca reported titre up by as much as 35% and glycation down by as much as 27% against manual bolus control S34. Each company compared with its own bolus feeding, and the abstracts do not give vessel sizes or run numbers, so the sizes of the effects cannot be compared. The direction is the same in all three.
What a model costs to build
The studies we read drew on five to 44 cultures for their models. Sartorius used five cultivations for its perfusion glucose model S09, and 13 Ambr 250 perfusion runs in which it deliberately varied the target cell density (25 to 100 million cells/mL), the cell-specific perfusion rate, three batch media, cross-flow and temperature S10; its conclusion is that robust perfusion models need different target cell densities and perfusion rates in the calibration set S10. Takeda ran 44 Ambr 250 vessels in four runs for one cell line, three runs for training and one for testing, with 440 samples for the glucose model and 275 native or 381 spiked samples for titre S11. GC Biopharma used 23 Ambr 250 batches S13, and Biogen eight bench batches designed to cover a wide glucose range, plus spiking studies S32.
Time is harder to pin down. A paper by FHNW and Merck KGaA describes the conventional industrial workflow, from preparing the runs to signal processing, as one that “can extend up to 6 months” S15; that is a description, not a survey. Takeda writes that large multi-process datasets or spiking studies are often prohibitive within normal development timelines S11. ICH Q14 sets no number of samples: it depends on how complex the sample is S03. ICH Q2(R2) adds that the reference method has to perform at least as well as the model is expected to S07, and reference methods are not exact either: Sartorius puts the error of an offline viable cell count at about 10% S16.
Three shortcuts have measured results, each from one study. TU Delft calibrated a yeast process from 16 spectra of single compounds and predicted glucose with a relative error of 4.8% S14. FHNW and Merck KGaA built synthetic spectral libraries from pure compounds and predicted glucose with an error of 0.27 g/L, against 0.20 g/L for a model with physically spiked samples S15. The IRUBIS one-point MIR calibration matched conventional models S21.
Where models break
Amgen states the problem directly: calibrated Raman models are reliable only under the conditions they were calibrated in, and they typically degrade with recipe changes, raw material variability and drift S31. The abstract gives no rate. Takeda adds that recalibrating for every process change is very resource intensive S11. The studies we read document four kinds of change.
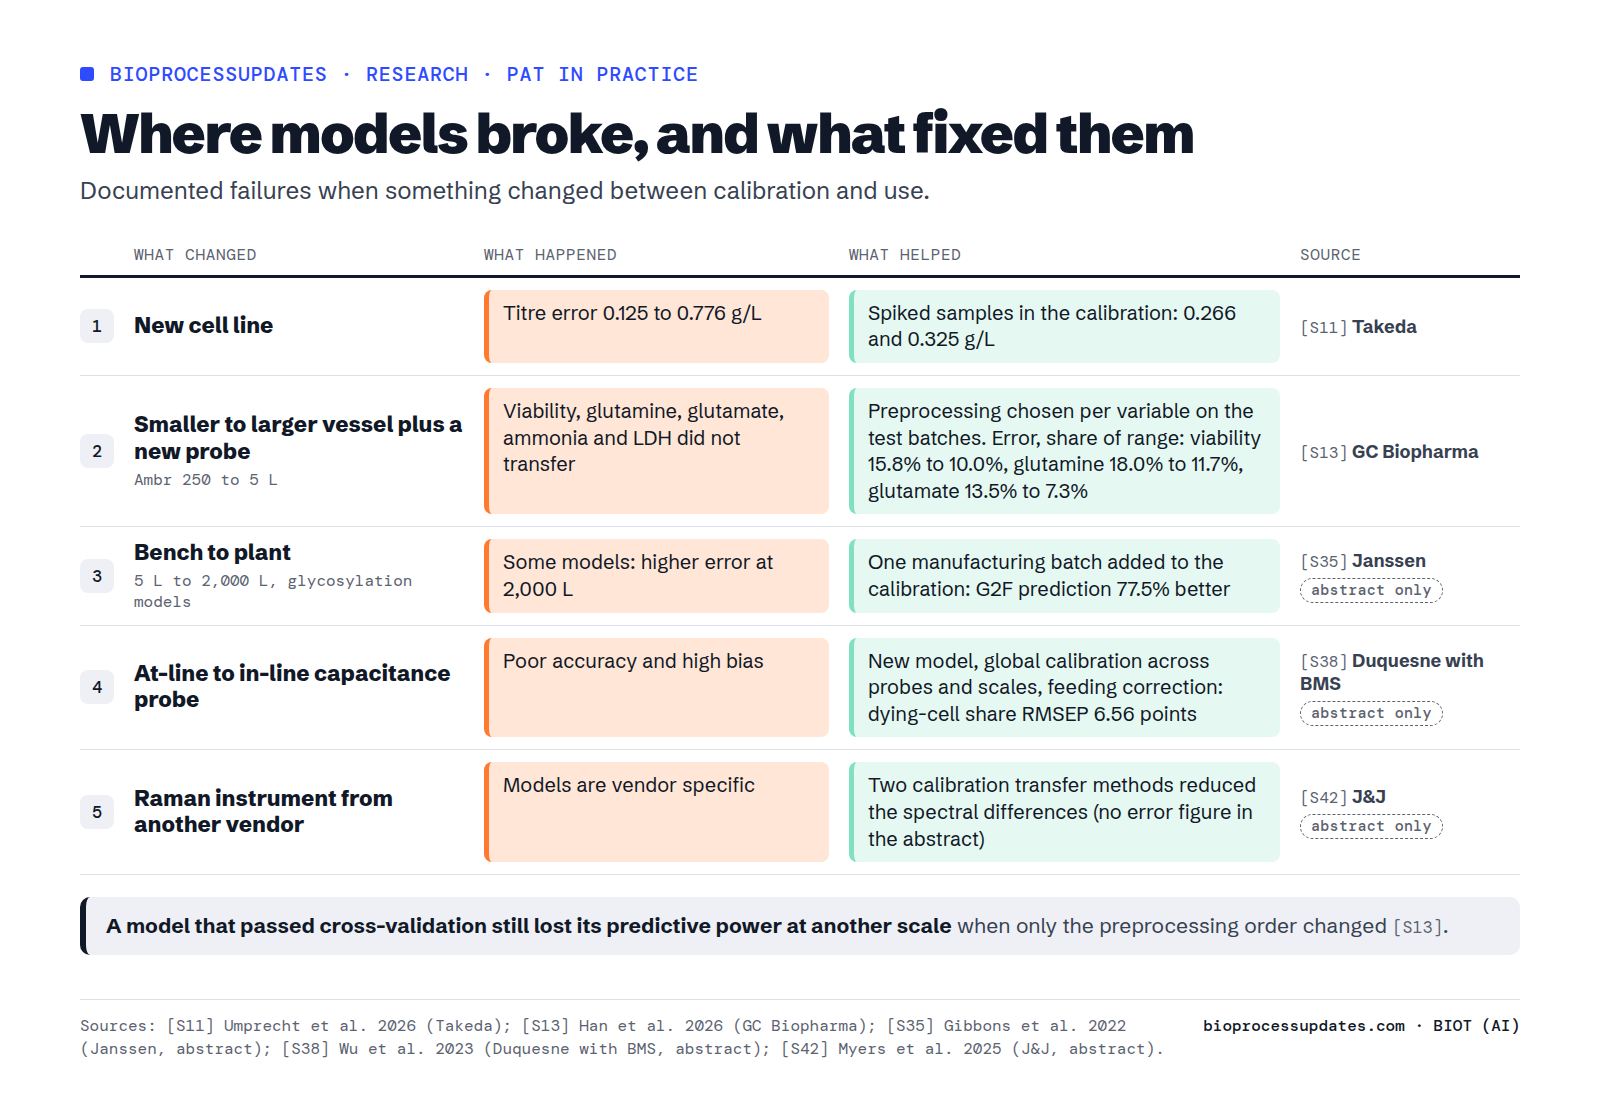
A new cell line. Takeda’s glucose and lactate models moved to a second cell line with little loss: 3.00% and 2.81% normalised error on the first, 4.74% and 3.32% on the second S11. Its titre model did not. Trained on native samples, it erred by 0.125 g/L on its own cell line and by 0.776 g/L on the new one S11, about six times more. The cause was a correlation between lactate and titre in the original process S11. With spiked samples in the calibration, the titre errors were 0.266 and 0.325 g/L S11.
A larger vessel. GC Biopharma trained models on Ambr 250 data and tested them on five 5 L batches with a different probe and detector, so scale and instrument changed at once S13. Viable cell density, glucose and lactate transferred; viability, glutamine, glutamate, ammonia and LDH did not S13. Choosing the preprocessing per variable brought the errors, as a share of the measured range, down for viability from 15.8% to 10.0% and for glutamine from 18.0% to 11.7%; the pipelines were chosen on the same five test batches, so by our reading these gains are optimistic S13. The same paper shows a trap: a model that passed cross-validation lost its predictive power at the other scale when only the order of the preprocessing steps changed S13. At Janssen, some glycosylation models that were accurate at 5 L showed higher errors at 2,000 L, and adding a single manufacturing batch to the calibration improved the G2F prediction by 77.5% S35. ICH Q14 recommends including commercial-scale samples in the calibration S03, and the ICH paper of 2011 calls it important to verify a laboratory model at commercial scale when it is part of the control strategy S05.
A new probe. Duquesne University and Bristol Myers Squibb moved a capacitance model of the share of dying cells from an at-line probe to in-line probes. Moved directly, it was inaccurate and biased; after a new model, a global calibration across probes and scales and a preprocessing step against feeding interference, it predicted the share with a root mean square error of 6.56 percentage points S38. ICH Q14 notes the reverse case: a failure can come from the measurement system, such as a misaligned sample interface, and then the model needs no update S03.
A new instrument vendor. Johnson & Johnson found that Raman hardware and software leave vendor-specific marks in the spectra, so models are tied to one vendor, which complicates transfers between sites and the replacement of old equipment. Two calibration transfer methods reduced the differences between an old and a new system S42. We read the abstract, which gives no error figures.
Process events can also disturb a signal. In the off-gas study, antifoam and feed additions showed up immediately in the gas traces S22. Two practices from the papers reduce false confidence: validating by leaving out whole batches, so that samples from the same batch do not leak into the test S26, and avoiding too many latent variables, which can overfit the model and lead to more frequent updates S03. No source we read says how often a plant actually had to recalibrate.
Capacitance: right while cells grow, off when they swell
A capacitance probe relies on intact cells acting as small capacitors in an electric field, so the signal is proportional to the viable cell volume S17. Sartorius fitted these probes to single-use bioreactors from 50 to 2,000 L in two industrial CHO fed-batch processes S16. Linear models described the viable cell count with an R2 of 0.99 and 0.96, but only in the exponential growth phase S16. In the death phase the cells swell and the signal stops tracking the count, so the vendor left those points out of its fit S16. The feed additions were visible in the signal, so the feeding could be followed online S16.
A second Sartorius paper measured the cost of that limit in a 26-day perfusion run. For the first eight days a single-frequency model and a multifrequency model did equally well, with errors of 5.04 and 5.13 million cells/mL S18. Between day 7 and day 10 the viable cells grew more than 16% in diameter S18. Over the whole run the single-frequency error rose to 7.75 million cells/mL, against 4.05 million for the multifrequency model S18, and from day 8 the average relative errors were 21% and 7% S18. The authors note that online applications often still rely on a single frequency S18. A study from the University of Manitoba and the National Research Council of Canada, partly a simulation, explains why: the signal depends on both the size and the number of cells, and late in a culture a subpopulation of dying cells with different properties appears S19. WuXi Biologics names accuracy in the stationary and decline phases as an open challenge S39.
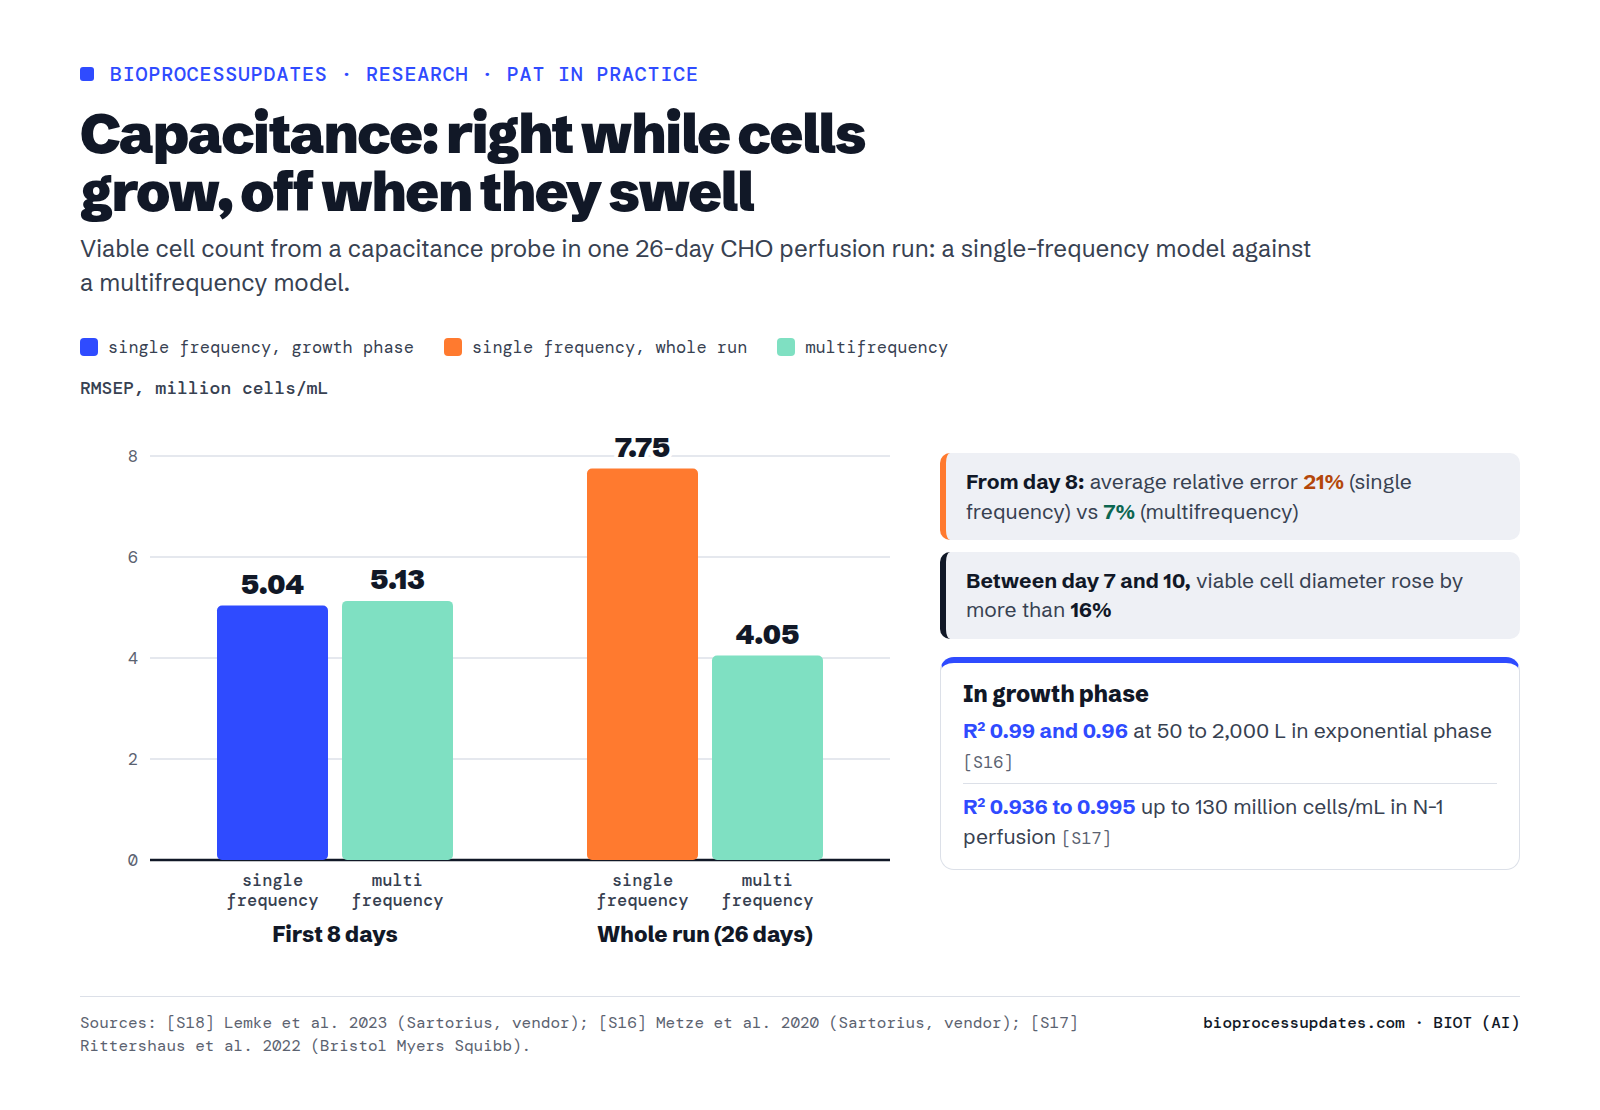
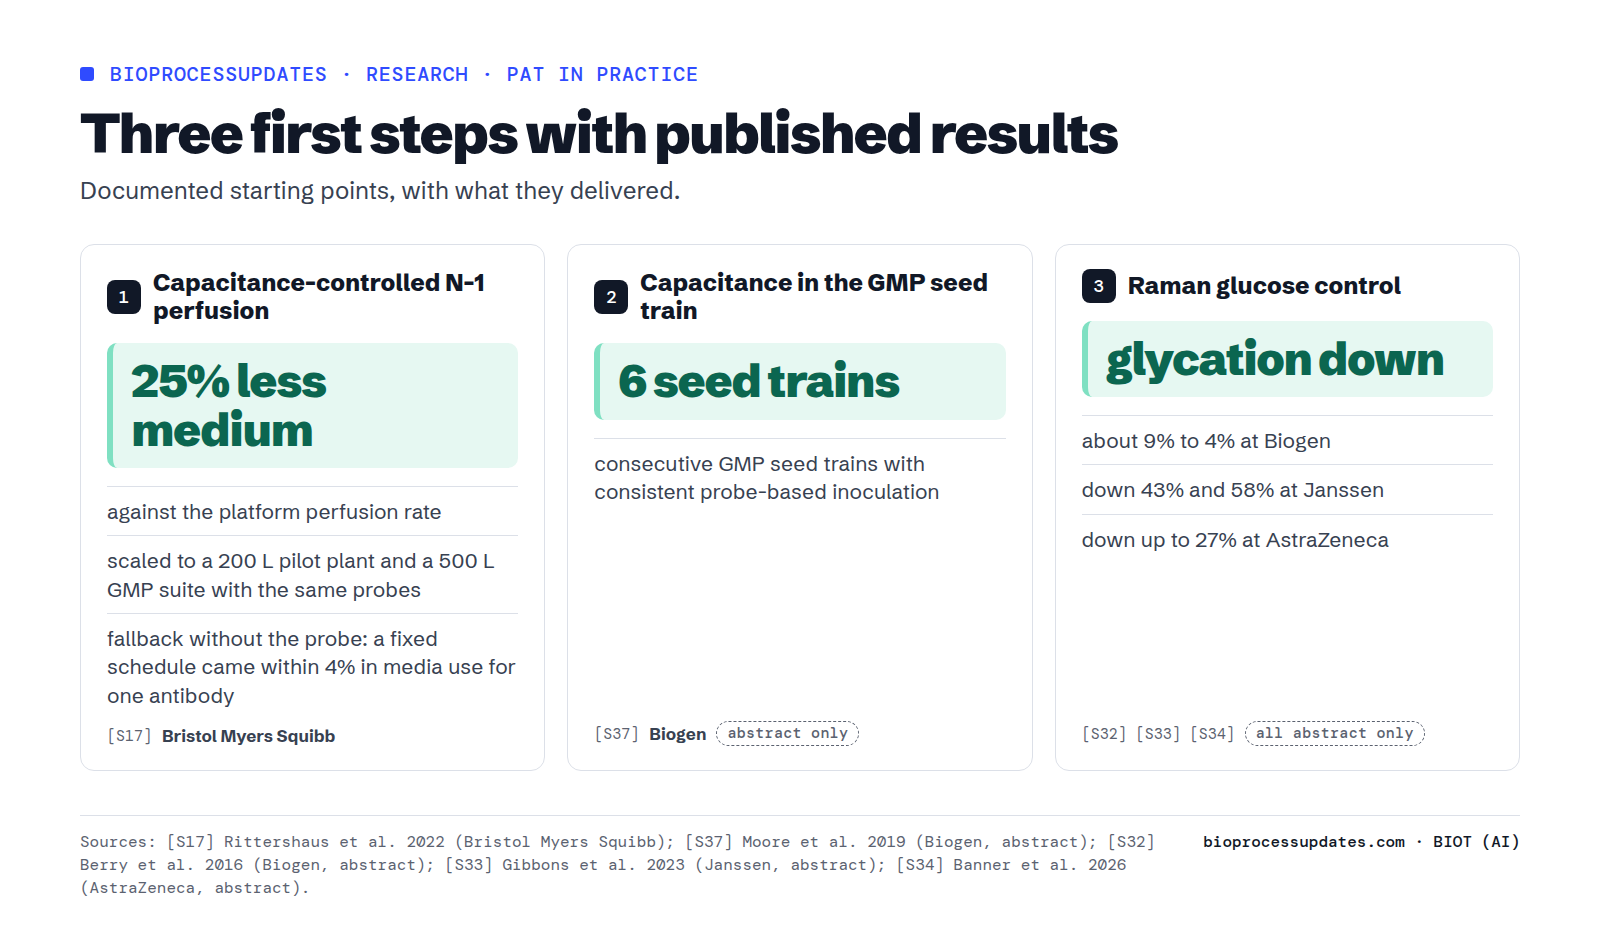
The control uses are the strongest part of the evidence. Bristol Myers Squibb used an in-line probe to set the perfusion rate of N-1 seed cultures, the stage before the production bioreactor (how perfusion works is in Perfusion, explained). The signal was linear with the offline count up to 130 million cells/mL, R2 0.936 to 0.995 for six clones S17, which held because N-1 cultures stay in exponential growth S17. Setting the perfusion rate per cell instead of per vessel volume cut medium use by about 25%, with no harm to growth S17. One rate, 0.04 nL per cell per day, worked for four of the six cell lines S17, and the same probes were used to scale the process to a 200 L pilot plant and a 500 L GMP suite S17. BMS also describes a fallback: a fixed schedule derived from the probe runs, for plants without a probe or after a probe failure; for one antibody it reached 57 against 65 million cells/mL, with media use 4% apart S17. Biogen used the probe in commercial GMP manufacturing to automate seed-train dilution, with consistent results over six consecutive GMP seed trains S37, which we read as an abstract.
For perfusion bleed control the numbers are few. In the FHNW and Merck KGaA perfusion runs, a capacitance probe held the viable cell volume at 12% S15. In Sartorius minibioreactors, a bleed driven by the Raman cell count kept cultures near 40 million cells/mL with a mean absolute error of 5.97 million, against 3.90 million when the bleed followed an automated cell counter S10, about 15% and 10% of the target by our calculation.
Soft sensors and hybrid models
A soft sensor is, in ICH Q13’s words, a model used “in lieu of physical measurement” to estimate a variable from process data S04. The examples with measured results are all at development scale. Bilfinger and BOKU computed the oxygen uptake rate from a dynamic model of oxygen transfer, without an off-gas analyser, and applied it to 13 CHO fed-batch runs; in the runs that could be compared with off-gas analysis it deviated by 8% on average, and it followed the viable biomass S23. Alexion, Amgen and Hamilton combined optical density and permittivity into soft sensors for viability, with 96% of residuals within plus or minus 5%, and for viable cell density, with an R2 of 0.92 S40; we read the abstract. A neural network from the National Research Council of Canada predicted next-day titre, growth and metabolites with an average R2 of 0.97 S25, but it was built from 21 runs, 17 for training and four held out for testing, two of them from one cell pool S25.
The comparisons between model types point both ways. In UMass Lowell shake flask cultures, a mechanistic model predicted growth and titre best with fewer inputs, while data-driven models predicted glycans better and were faster to build S24. Imperial College London adapted a mechanistic model to a new system with a single dataset, with every state of the model measured, which the authors say this kind of transfer needs S27. We found no soft sensor or hybrid model in GMP use with published accuracy.
Downstream, briefly
The downstream studies we read report no manufacturing-scale results. A 2017 study at the Karlsruhe Institute of Technology measured antibody in the Protein A column effluent with UV/Vis spectra and a regression model, with an error of 0.06 mg/mL, and stopped loading automatically at a set breakthrough S28. The point was to replace loads set conservatively from an offline titre and resin lifetime studies S28. IIT Delhi used NIR flow cells to measure antibody in the harvest every 3 seconds within plus or minus 0.05 mg/mL and to control loading in a three-column continuous system S41, read as an abstract. ICH Q13 names in-line UV flow cells for protein concentration as a PAT example S04. A 2026 review co-authored by Johnson & Johnson rates technology readiness as high for UV/Vis, refractive index, liquid chromatography and mass spectrometry, medium for Raman and FTIR, and low for NMR and light scattering S29.
Cost: mostly unmeasured
The FDA guidance lists the expected gains, shorter cycle times, fewer rejects, real time release, more automation, with no figures S01. The one measured saving we found is the 25% less medium at Bristol Myers Squibb S17, measured against the company’s own platform rate. The review gives price estimates for downstream analysers, from under EUR 50,000 for a refractive index detector to over EUR 150,000 for Raman and over EUR 200,000 for mass spectrometry S29; they are the authors’ estimates, and the method is not given. The off-gas study reports one clogged filter caught in time S22, and the Manitoba group calls offline cell counting costly and often too late to act on S19. We found nothing on labour saved by fewer manual samples, batches saved, installed cost of an upstream system or payback time. On cost, the honest answer is that it has not been published.
Where to start
Few companies go all the way. A survey of Japanese approval reviews found that the share of new active ingredients developed with quality by design elements rose from 9% in 2009 to 71% in 2018, but design space was used in 2% and real time release testing in 3% S43. The authors conclude that applicants did not actively seek that flexibility S43. That survey covers all new active ingredients, not only biologics, and we read the abstract.
The first steps with published results are three. Capacitance in N-1 perfusion: 25% less medium, taken to a GMP suite, with a fallback schedule if the probe fails S17. Capacitance for seed-train dilution: six consecutive GMP seed trains S37. And glucose control from Raman, with less glycation at three companies S32 S33 S34. The first two use the probe where it works best, while cells grow.
The rest is advice, and the sources say so. The FDA recommends starting during development S01. Sartorius, a vendor, recommends generating calibration data early in small high-throughput bioreactors S10. Lonza argues for generic platform models because processes are typically run only once or twice in GMP manufacturing S30. Bristol Myers Squibb says that even a plant without the probe benefits from a process developed with it S17. IRUBIS lists the hurdles as cost, the lack of single-use parts, laborious calibration and the need for chemometrics skills S21.
What it means for a plant
- Start where the payoff is published. Capacitance while cells grow, in the seed train or N-1 S17 S37, and Raman glucose control S32 S33 S34.
- Ask for the error on independent runs, in your range. R2 and cross-validated errors flatter; a model that passed cross-validation still failed at another scale S13.
- Treat calibration as a project. Plan cultures that vary cell density, perfusion rate and media on purpose S10, and spike samples if titre matters S11.
- Write the triggers down. New cell line, new scale and new probe each broke a model in the studies we read, and a new vendor ties a model to one instrument S11 S13 S38 S42. Keep a fallback, as BMS did with its fixed schedule S17.
- Do not trust a single-frequency capacitance reading after growth stops. Once the cells swelled, its error was three times that of a multifrequency model, 21% against 7% S18.
- Be wary of models for things the probe cannot see. They work through correlation S12, and the Takeda titre model shows what happens when a correlation changes S11.
- Keep real time release as a separate decision. RTRT needs prior approval, and in the EU a failing RTRT result cannot be replaced by an end-product test S06; trying an experimental analyser for research needs no notice to the FDA S01.
Questions
What is process analytical technology (PAT) in biomanufacturing?
In ICH Q8(R2)’s words, a system for designing, analysing and controlling manufacturing through timely measurements of critical quality and performance attributes S02. In a bioreactor that usually means probes such as Raman, NIR or capacitance, read in-line or on-line, plus the models that turn their signals into concentrations or cell counts.
Is PAT required by the FDA or the EMA?
No. The FDA’s 2004 guidance calls it voluntary S01, and ICH Q8(R2), Q13 and Q14 and the EMA guideline say the enhanced approach and real time release testing are not required S02 S04 S03 S06. Real time release testing, if a company chooses it, needs approval first S01 S06.
What can Raman spectroscopy measure in a bioreactor?
Glucose is the most reliable, with errors of 0.20 to 0.44 g/L in the studies we read S09 S10 S15 S30; lactate usually works, but one model failed when lactate varied too little S09. Glutamate, ammonium, viable cell count and titre can also be modelled, but with larger errors; in one study titre and cell counts were off by 21 to 24% of their average S10.
What is a capacitance probe used for in cell culture?
To estimate viable cell density or viable cell volume in real time. It works well in the growth phase, R2 0.99 at up to 2,000 L S16, and is used to control perfusion rates and seed-train dilution S17 S37. Once growth stops, a single-frequency reading drifts because cells change size S16 S18.
What is real time release testing?
Judging the quality of a batch from process data instead of from tests on the finished product S01. It replaces end-product testing but not the GMP review of the batch S02.
How often do PAT models need recalibration?
No regulator gives a number. ICH Q14 asks for periodic and event-driven checks against reference results S03, ICH Q13 for routine and ongoing maintenance S04, and the frequency is left to the company’s risk assessment S05. In practice, the studies we read show models failing after a change of cell line, scale or probe, and models tied to one instrument vendor S11 S13 S38 S42.
What is a soft sensor?
A model used instead of a physical measurement to estimate a variable from process data S04. One example, applied to 13 CHO runs, estimated the oxygen uptake rate with an average deviation of 8% from off-gas analysis in the runs that could be compared S23.
What we could not verify
- FDA documents after 2004, such as its programme for emerging technologies: the FDA website did not let us download them, so the FDA position here is the 2004 guidance only. ICH Q12 was not read.
- Any primary data on 2D fluorescence, online HPLC with automated sampling, probe fouling, sterilisation effects or single-use probes.
- How often a plant actually had to recalibrate a model.
- A soft sensor or hybrid model in GMP use with published accuracy, and any downstream PAT result at manufacturing scale.
- A survey of PAT adoption in biomanufacturing; the only adoption figure is from Japanese reviews of all new active ingredients S43.
- Cost, labour and payback.
- The conditions behind the abstract-only results, including all three glucose control studies with product quality data S32 S33 S34 and the manufacturing-scale Raman studies S35 S36.
Sources
- S01 U.S. Food and Drug Administration (CDER, CVM, ORA), Guidance for Industry. PAT, A Framework for Innovative Pharmaceutical Development, Manufacturing, and Quality Assurance. FDA guidance for industry, September 2004, 2004 (regulator document). Published before 2015.
- S02 International Council for Harmonisation (ICH) Expert Working Group, ICH Q8(R2) Pharmaceutical Development. ICH harmonised tripartite guideline, Step 4 (R2 August 2009), 2009 (regulator document). Published before 2015.
- S03 International Council for Harmonisation (ICH) Expert Working Group, ICH Q14 Analytical Procedure Development. ICH harmonised guideline, adopted 1 November 2023, 2023 (regulator document).
- S04 International Council for Harmonisation (ICH) Expert Working Group, ICH Q13 Continuous Manufacturing of Drug Substances and Drug Products. ICH harmonised guideline, adopted 16 November 2022, 2022 (regulator document).
- S05 ICH Quality Implementation Working Group, ICH Quality Implementation Working Group Points to Consider (R2): ICH-Endorsed Guide for ICH Q8/Q9/Q10 Implementation. ICH, document dated 6 December 2011, 2011 (regulator document). Published before 2015.
- S06 European Medicines Agency, CHMP, Guideline on Real Time Release Testing (formerly Guideline on Parametric Release), EMA/CHMP/QWP/811210/2009-Rev1. EMA scientific guideline, in effect 1 October 2012, 2012 (regulator document). Published before 2015.
- S07 International Council for Harmonisation (ICH) Expert Working Group, ICH Q2(R2) Validation of Analytical Procedures. ICH harmonised guideline, adopted 2023, 2023 (regulator document).
- S08 European Medicines Agency, CHMP and CVMP, Reflection paper on the use of Artificial Intelligence (AI) in the medicinal product lifecycle, EMA/CHMP/CVMP/83833/2023. EMA reflection paper, final version 9 September 2024, 2024 (regulator document).
- S09 Graf A et al., A Novel Approach for Non-Invasive Continuous In-Line Control of Perfusion Cell Cultivations by Raman Spectroscopy. Front Bioeng Biotechnol 10:719614, 2022. Affiliations: Sartorius Stedim Biotech (vendor of the bioreactors, Raman flow cell and software used) with Reutlingen University (academic). Vendor-authored.
- S10 Machleid R et al., Advancing Raman Calibration: Automated Data Generation, Monitoring, and Control in Multi-Parallel Perfusion Mini Bioreactors. Biotechnol J 21:e70208, 2026. Affiliations: Sartorius Stedim Biotech, Sartorius Stedim Cellca, Sartorius Stedim Data Analytics (vendor of the Ambr system, Raman flow cell and SIMCA software) with Umea University. Vendor-authored.
- S11 Umprecht A et al., Rapid development of a transferable Raman model using high-throughput cell culture for monitoring monoclonal antibody titer. Biotechnol Prog e88506, 2026. Affiliations: Takeda (Baxalta Innovations, Vienna; Takeda Lexington), biopharma company, with TU Wien (academic). Equipment: Sartorius Ambr 250 and BioPAT Spectro.
- S12 Tanemura H et al., Comprehensive modeling of cell culture profile using Raman spectroscopy and machine learning. Sci Rep 13:21805, 2023. Affiliations: Daiichi Sankyo (biopharma company).
- S13 Han SH et al., Variable-specific preprocessing enables cross-scale transferable Raman models from high-throughput bioreactor data. Bioresour Bioprocess 13:122, 2026. Affiliations: GC Biopharma (biopharma company, MSAT) with Sungkyunkwan University (academic).
- S14 Klaverdijk M et al., Towards Rapid Calibration of Bioprocess Quantification Models Using Single Compound Raman Spectra: A Comparison of Four Approaches. Biotechnol Bioeng 123:324-336, 2026. Affiliations: TU Delft (academic). Yeast (microbial) processes.
- S15 Hellequin LV et al., Synthetic spectral libraries for Raman model calibration. Anal Bioanal Chem 417:5675-5689, 2025. Affiliations: FHNW and RWTH Aachen (academic) with Merck KGaA Biotech Process Sciences (biopharma company) and Levitronix (vendor of pumps, author affiliation of one co-author).
- S16 Metze S et al., Monitoring online biomass with a capacitance sensor during scale-up of industrially relevant CHO cell culture fed-batch processes in single-use bioreactors. Bioprocess Biosyst Eng 43:193-205, 2020. Affiliations: Sartorius Stedim Biotech (vendor of the single-use bioreactors and of the capacitance sensor integration). Vendor-authored peer-reviewed paper.
- S17 Rittershaus ESC et al., N-1 Perfusion Platform Development Using a Capacitance Probe for Biomanufacturing. Bioengineering (Basel) 9:128, 2022. Affiliations: Bristol Myers Squibb (biopharma company). Probe: Hamilton Incyte.
- S18 Lemke J et al., Online deployment of an O-PLS model for dielectric spectroscopy-based inline monitoring of viable cell concentrations in Chinese hamster ovary cell perfusion cultivations. Eng Life Sci 23:e2200053, 2023. Affiliations: Sartorius (vendor of the SCADA and multivariate software used). Vendor-authored short communication.
- S19 Salimi E et al., Sensitivity of bulk electrical impedance spectroscopy (bio-capacitance) probes to cell and culture properties: Study on CHO cell cultures. Biotechnol Prog 41:e3519, 2025. Affiliations: University of Manitoba (academic) and National Research Council Canada (public research body). Model-based sensitivity analysis with CHO batch data.
- S20 Kozma B et al., On-line glucose monitoring by near infrared spectroscopy during the scale up steps of mammalian cell cultivation process development. Bioprocess Biosyst Eng 42:921-932, 2019. Affiliations: Budapest University of Technology and Economics (academic) with Gedeon Richter (biopharma company, production site of the runs).
- S21 Marienberg H et al., Automized inline monitoring in perfused mammalian cell culture by MIR spectroscopy without calibration model building. Eng Life Sci 24:e2300237, 2024. Affiliations: IRUBIS GmbH (vendor of the MIR analyser) with Amgen Research (biopharma company). Vendor co-authored.
- S22 Goh HY et al., Applications of off-gas mass spectrometry in fed-batch mammalian cell culture. Bioprocess Biosyst Eng 43:483-493, 2020. Affiliations: University College London (academic) with Thermo Fisher Scientific (vendor of the mass spectrometer). Vendor co-authored.
- S23 Pappenreiter M et al., Oxygen Uptake Rate Soft-Sensing via Dynamic kLa Computation: Cell Volume and Metabolic Transition Prediction in Mammalian Bioprocesses. Front Bioeng Biotechnol 7:195, 2019. Affiliations: Bilfinger Industrietechnik Salzburg (engineering company) with BOKU Vienna (academic).
- S24 Liang G et al., Soft-sensor model development for CHO growth/production, intracellular metabolite, and glycan predictions. Front Mol Biosci 11:1441885, 2024. Affiliations: University of Massachusetts Lowell (academic). Shake-flask data.
- S25 Reyes SJ et al., A recurrent neural network for soft sensor development using CHO stable pools in fed-batch process for SARS-CoV-2 spike protein production as a vaccine antigen. Biotechnol Prog 41:e70046, 2025. Affiliations: National Research Council Canada (public research body) with Polytechnique Montreal (academic).
- S26 Del Hierro AG et al., Real-Time Biomass Estimation in High-Density Yeast Fermentations Using Soft Sensor Modeling. Biotechnol Bioeng 123:2389-2405, 2026. Affiliations: University College Dublin (academic) with Bionet (Spanish bioreactor vendor, Fuente Alamo) and Probelte/Agronova Biotech (Spanish company). Vendor co-authored.
- S27 Yu L et al., Model-Enabled Knowledge Transfer Across Cell Lines, Culture Scales and Conditions. Biotechnol Bioeng 123:2613-2628, 2026. Affiliations: Imperial College London (academic).
- S28 Rüdt M et al., Real-time monitoring and control of the load phase of a protein A capture step. Biotechnol Bioeng 114:368-373, 2017. Affiliations: Karlsruhe Institute of Technology (academic).
- S29 Carvalho M et al., A Review on Quantitative Process Analytical Technology for Continuous Downstream Processing of Monoclonal Antibodies. Biotechnol Bioeng 123:564-581, 2026 (review). Affiliations: TU Delft (academic) with Johnson & Johnson Innovative Medicine (biopharma company). Review: used as a pointer and for its cost estimates, which are the authors’ estimates.
- S30 Webster TA et al., Development of generic Raman models for a GS-KO CHO platform process. Biotechnol Prog 34:730-737, 2018. Affiliations: Lonza Biologics (CDMO, own platform). Abstract read.
- S31 Tulsyan A et al., Automatic real-time calibration, assessment, and maintenance of generic Raman models for online monitoring of cell culture processes. Biotechnol Bioeng 117:406-416, 2020. Affiliations: Amgen (biopharma company). Abstract read.
- S32 Berry BN et al., Quick generation of Raman spectroscopy based in-process glucose control to influence biopharmaceutical protein product quality during mammalian cell culture. Biotechnol Prog 32:224-234, 2016. Affiliations: Biogen (biopharma company). Pre-2018, seminal for Raman glucose control. Abstract read.
- S33 Gibbons L et al., An assessment of the impact of Raman based glucose feedback control on CHO cell bioreactor process development. Biotechnol Prog 39:e3371, 2023. Affiliations: Janssen (Johnson & Johnson), biopharma company, with Munster Technological University. Abstract read.
- S34 Banner M et al., Advanced glucose control strategies leveraging Raman spectroscopy for optimized mammalian cell culture manufacturing. Biotechnol Prog e88531, 2026. Affiliations: AstraZeneca (biopharma company) with University College London. Abstract read.
- S35 Gibbons LA et al., Raman based chemometric model development for glycation and glycosylation real time monitoring in a manufacturing scale CHO cell bioreactor process. Biotechnol Prog 38:e3223, 2022. Affiliations: Janssen (Johnson & Johnson), biopharma company, with Munster Technological University. Abstract read.
- S36 Shen Y et al., Machine Learning-Enhanced Generic Raman Model for Commercial-Scale Cell Culture Process Monitoring. Biotechnol J 21:e70309, 2026. Affiliations: BioRay Biopharmaceutical (biopharma company) with Zhejiang University. Abstract read.
- S37 Moore B et al., Case study: The characterization and implementation of dielectric spectroscopy (biocapacitance) for process control in a commercial GMP CHO manufacturing process. Biotechnol Prog 35:e2782, 2019. Affiliations: Biogen (biopharma company). Abstract read.
- S38 Wu S et al., Capacitance spectroscopy enables real-time monitoring of early cell death in mammalian cell culture. Biotechnol J 18:e2200231, 2023. Affiliations: Duquesne University (academic) with Bristol-Myers Squibb (biopharma company). Abstract read.
- S39 Sun Y et al., Real-Time Auto Controlling of Viable Cell Density in Perfusion Cultivation Aided by In-Line Dielectric Spectroscopy With Segmented Adaptive PLS Model. Biotechnol Bioeng 122:858-869, 2025. Affiliations: WuXi Biologics (CDMO). Abstract read.
- S40 Suman S et al., In-line prediction of viability and viable cell density through machine learning-based soft sensor modeling and an integrated systems approach: An industrially relevant PAT case study. Biotechnol Prog 41:e3520, 2025. Affiliations: Alexion and Amgen (biopharma companies) with Hamilton Company (vendor of the optical density and permittivity probes). Vendor co-authored. Abstract read.
- S41 Thakur G et al., An NIR-based PAT approach for real-time control of loading in Protein A chromatography in continuous manufacturing of monoclonal antibodies. Biotechnol Bioeng 117:673-686, 2020. Affiliations: Indian Institute of Technology Delhi (academic). Abstract read.
- S42 Myers NM et al., Calibration Transfer Across Instrument Vendors for Bioprocess Raman Monitoring. AAPS J 28:5, 2025. Affiliations: Johnson & Johnson Innovative Medicine (biopharma company). Abstract read.
- S43 Kajiwara E et al., Impact of Quality by Design Development on the Review Period of New Drug Approval and Product Quality in Japan. Ther Innov Regul Sci 54:1192-1198, 2020. Affiliations: Tokyo University of Science (academic); first author also MSD K.K. (biopharma company). Survey of PMDA review reports. Abstract read.