Every scale-up starts with the same question: which number do we keep constant? Power per volume, impeller tip speed, the oxygen transfer coefficient kLa, gas flow per volume or mixing time each has its advocates, and none of them can be held together with the others. We read 40 primary sources, from Chinese hamster ovary (CHO) cell culture papers by Takeda, Merck, UCB, Boehringer Ingelheim and Amgen to microbial studies at 12 to 600 m3 and the guidelines of the International Council for Harmonisation (ICH), to see what each criterion keeps, what it breaks, and where cell culture and microbial fermentation part ways. This is the pillar of our scale-up series. Its first piece, From 2 L to 2,000 L: what breaks, looks at what goes wrong in CHO processes in detail.
The six findings in short
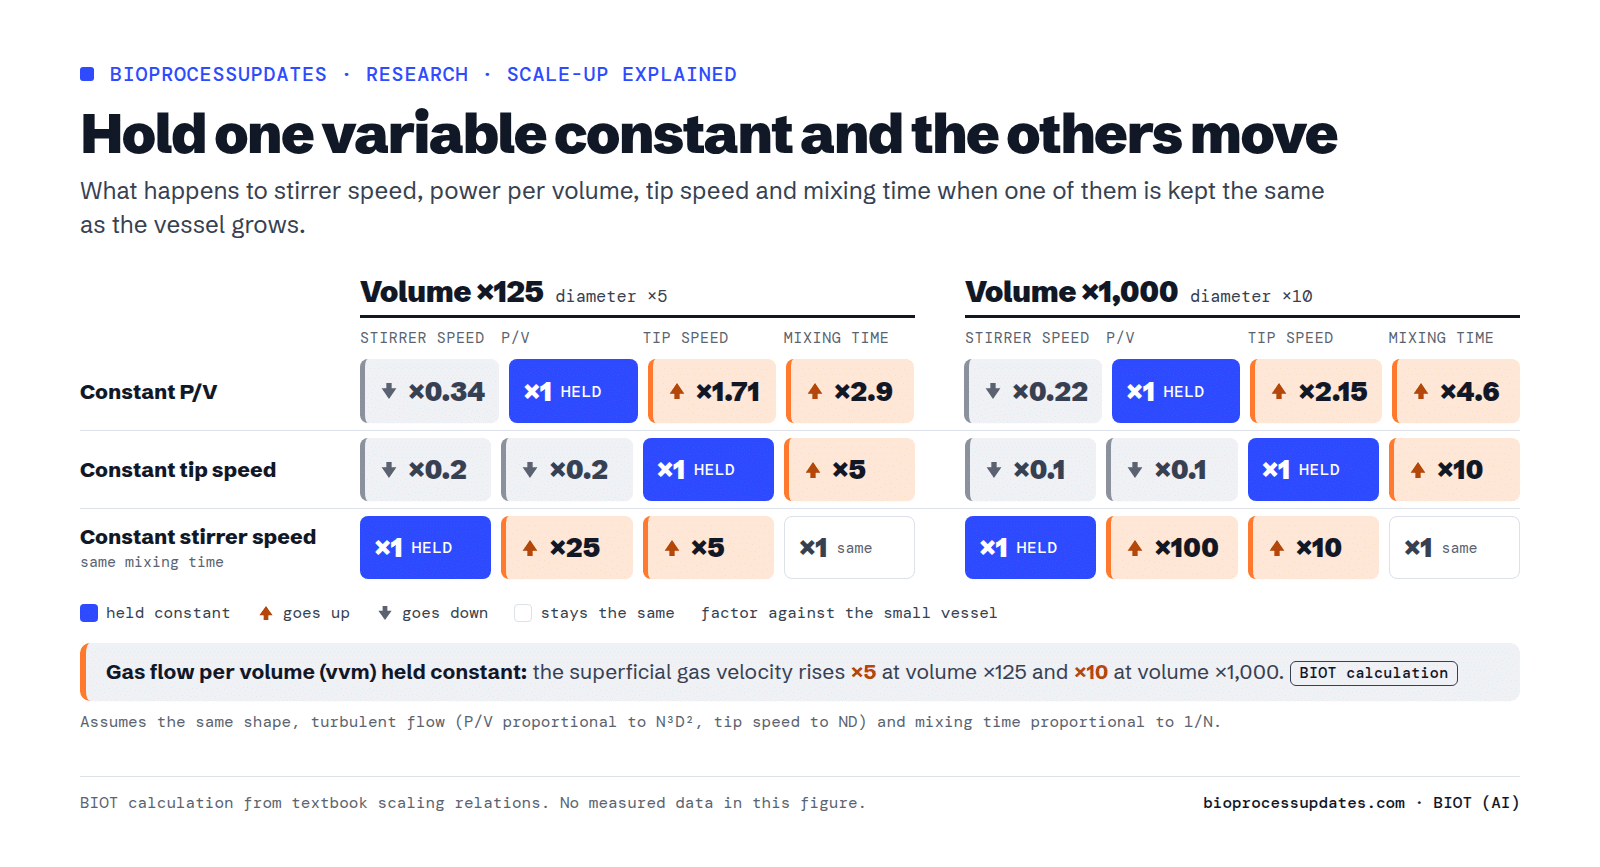
- No criterion can be held with the others. By our calculation, in a vessel of the same shape, keeping power per volume constant over a 1,000-fold volume increase roughly doubles tip speed and makes mixing about 4.6 times slower; keeping mixing time constant needs 100 times the power per volume. Every scale-up is a choice of what to let go. Confidence: high, this is geometry, and the sources agree.
- In cell culture, power per volume or kLa usually gets the oxygen right and the carbon dioxide wrong. Merck, Takeda and Bristol Myers Squibb all describe CO2 that the large vessel did not remove. The fixes targeted gas transfer: a minimum gas flow per volume (Merck), or agitation set to match the ratio of CO2 to O2 transfer (Takeda). Confidence: high, three companies agree, all read as abstracts.
- In microbial fermentation, oxygen and heat set the ceiling. Each mole of oxygen consumed releases about 460 kJ of heat. By our calculation, a culture taking up 150 mmol of oxygen per litre per hour, the top of the range the US National Renewable Energy Laboratory (NREL) simulated for industrial reactors, releases about 19 kW per cubic metre, some 55 times the load of a CHO culture at the 2.7 mmol per litre per hour peak measured in shaken flasks, while the wall area per cubic metre falls as the vessel grows. Confidence: medium; the plant numbers come from models.
- Mixing time grows from seconds to minutes, and microbes pay for it. Mixing takes under 5 to 10 seconds in small vessels and one to two minutes in simulations of microbial vessels of 54 to 600 m3. In a 12 m3 E. coli run, glucose reached up to 400 times the average when the feed entered a poorly mixed zone, and biomass yield fell by up to 20%. Confidence: high that gradients exist and can cost yield; medium on how much at a given plant.
- kLa correlations do not travel. The exponents in published kLa equations range from 0.28 to 0.74 on power per volume and from 0.2 to 0.77 on gas velocity. In a UCB conference paper, by our calculation, the 2 L equation predicts a kLa 44% below the value UCB took from its own kLa measurements of the 80 L vessel. Measure kLa at each scale. Confidence: high.
- Regulators ask for scale-independent parameters and representative small-scale models, not for a particular criterion. ICH Q8(R2) gives shear rate instead of agitation rate as its example, and ICH Q11 asks for scaling factors for scale-dependent steps. Confidence: high, these are the texts.
How we built this
We read 25 sources in full text and 15 from the abstract only, and cite 34. Most are papers by companies that make biologics or industrial products (Takeda, Merck, UCB, Bristol Myers Squibb, Boehringer Ingelheim, Amgen, Ipsen, Genomatica, DSM, Novonesis) and by universities, many of them with an industrial co-author. One cited source was written by an equipment maker (Sartorius) and one has a co-author from a sensor maker (Freesense); both are marked in the source list. Where we computed something ourselves, the text and the figures say “BIOT calculation”. We also tried to build a scale-up calculator and test it against published scale-ups; it failed two of four checks, so this piece has no calculator (see “What we could not verify”). Each finding carries a confidence level: high when several independent sources agree, medium when the chain rests on one company’s data or on models, low when two studies at most.
What changes when the vessel grows
Scale factors in industry are large. A microbial process developed in 0.5 to 10 L fermentors may run at 20,000 to 2,000,000 L, so the scale factor ranges “from thousands to millions”, and a pilot plant usually runs at 1 to 10% of the final scale, according to Genomatica’s process team S11. The largest aerobic stirred tanks in operation hold up to about 500 m3, according to industry contacts quoted in an NREL study S25. Cell culture stops much earlier: the largest vessels in the sources we read hold 12,000 to 25,000 L S28 S27.
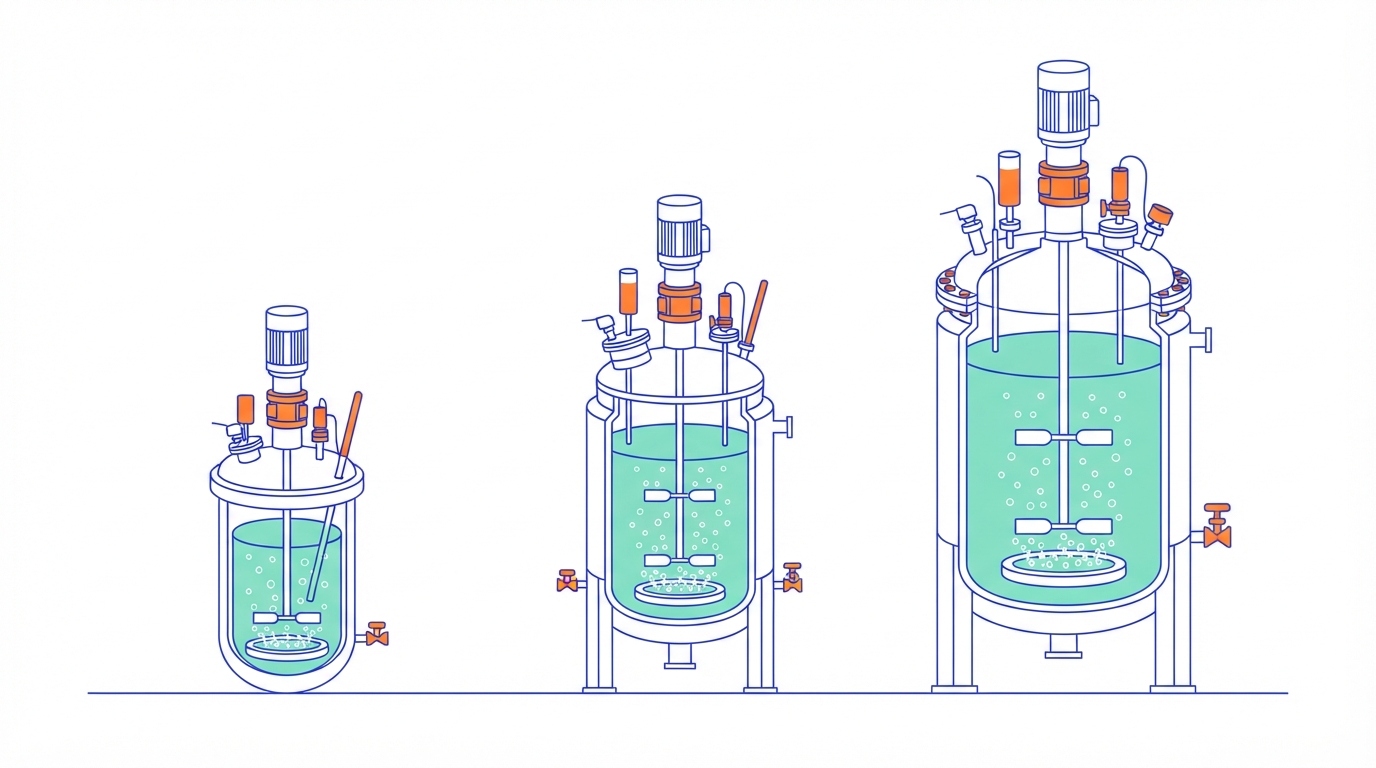
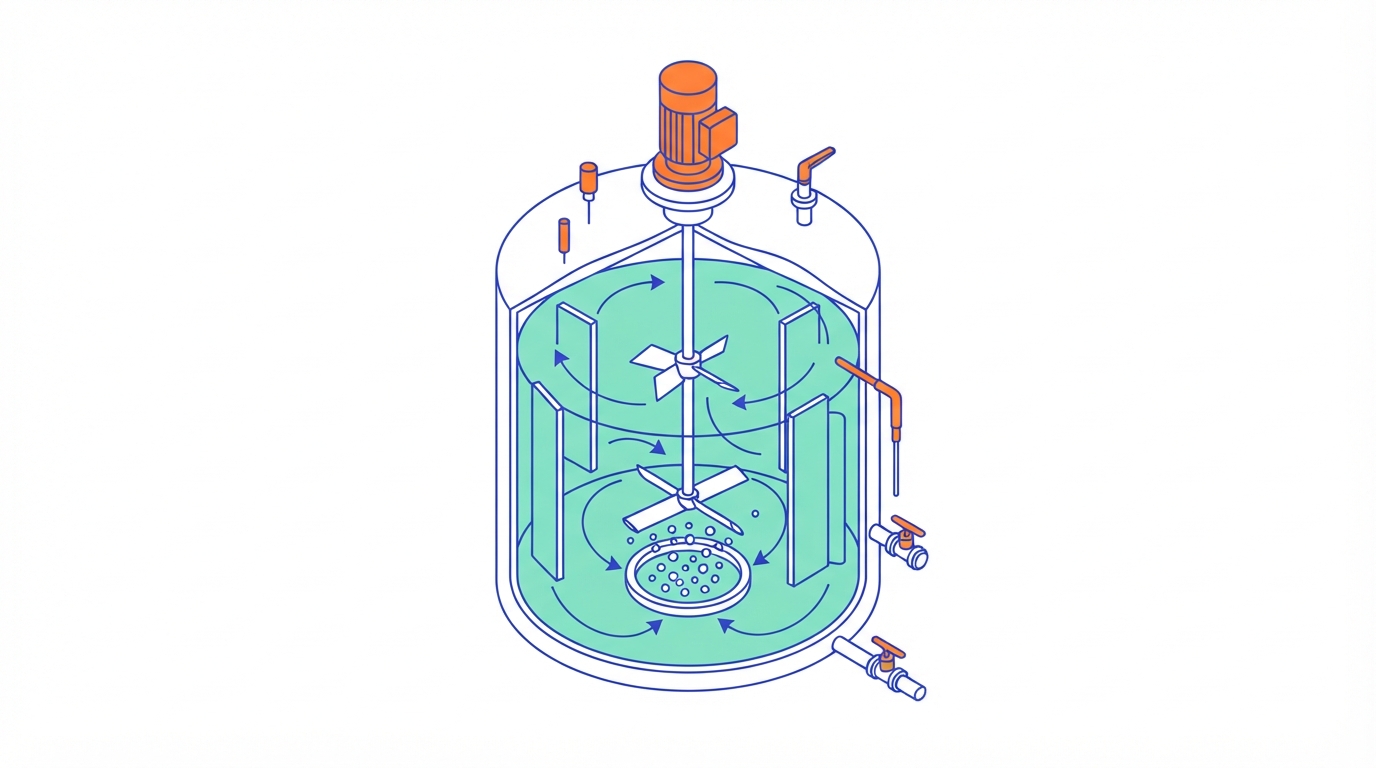
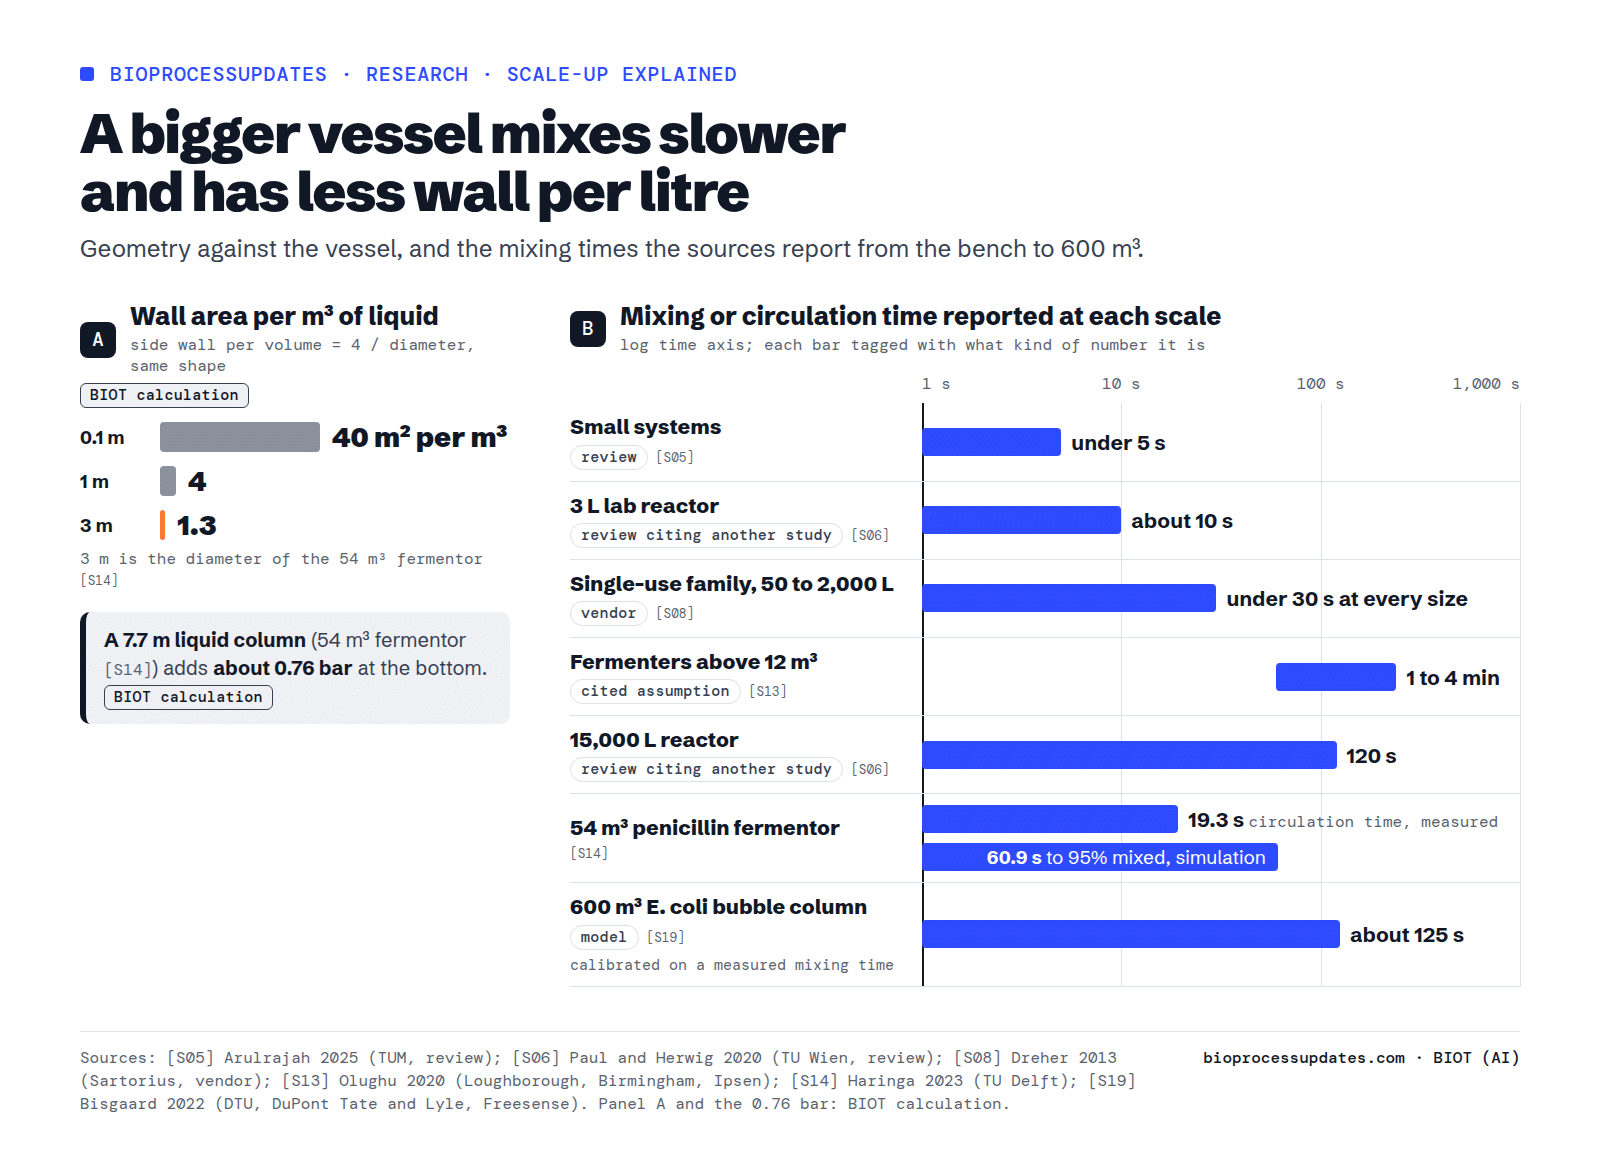
Three things change with size even when the shape stays the same. First, the wall and the liquid surface shrink relative to the volume. By our calculation, a cylinder of fixed proportions has 40 m2 of wall per cubic metre of liquid at 0.1 m diameter, 4 m2 at 1 m and 1.3 m2 at 3 m. Less wall per litre means less room for a cooling jacket, and less liquid surface per litre means weaker gas exchange through the surface; in water tests from 80 to 10,000 L, the gain in CO2 transfer from surface aeration shrank with scale, which Kyowa Hakko Kirin put down to the lower surface-to-volume ratio S30. Second, the liquid column gets taller. A 54 m3 penicillin fermentor holds 7.7 m of liquid S14; by our calculation that adds about 0.76 bar at the bottom, so oxygen and CO2 dissolve more at the sparger than near the surface, a vertical gradient Genomatica lists among the variables that grow with scale S11. Third, mixing takes longer.
How much longer? In small systems mixing times are “typically very short (< 5 s)”, a 2025 review notes S05. A review from TU Wien reports another group’s numbers: about 10 s in a 3 L vessel against 120 s at 15,000 L S06. Sartorius reports mixing times below 30 s at every size of its single-use family up to 2,000 L S08. In microbial production vessels the numbers are larger: a TU Delft simulation, without gas, of the 54 m3 penicillin fermentor, which has two Rushton impellers of 1.3 m at 98 rpm, gives a 95% mixing time of about 60 s, against a circulation time of 19.3 s measured in the plant S14; a model of a 600 m3 E. coli bubble column, calibrated on mixing measurements in the vessel itself, gives about 125 s S19; and a Loughborough, Birmingham and Ipsen team designed its scale-down experiments on the assumption, taken from earlier work, that vessels above 12 m3 mix in 1 to 4 minutes S13.
The scale-up criteria, one by one
The problem is stated in almost every source we read: “scale-dependent variables are interdependent, making it impossible to maintain all of them constant during scale-up” S01. The same Montreal team names the most used criteria: constant kLa, power per volume, tip speed and gas flow S01. For industrial microbial processes, the TU Wien and NovoArc team calls constant gassed power per volume or constant kLa “the industrial state-of-the-art”, citing two reviews S16.
Here is what each one keeps and what it gives up, for a vessel that keeps its proportions (the ratios are our calculation from the standard relations for turbulent flow; the evidence for each consequence is cited).
- Constant power per volume (P/V). Power input in watts per cubic metre of broth. It keeps the average energy that the impeller puts into each litre. By our calculation, over a 1,000-fold volume increase the stirrer turns at 0.22 times the speed, the tip moves 2.15 times faster and mixing takes about 4.6 times longer. With P/V or kLa held, “adequate oxygen supply and cell growth can be largely achieved”, Merck writes, but “CO2 stripping in the growth phase is often inadequate” S36.
- Constant tip speed. The speed of the impeller blade tip, in metres per second, often used as a proxy for the strongest shear. By our calculation, P/V falls to a tenth and mixing becomes about ten times slower over the same 1,000-fold step. “Maintaining impeller tip speeds constant reduces agitation, potentially leading to poor mixing” S01.
- Constant mixing time. By our calculation it means keeping the stirrer speed, which needs 100 times the P/V and 10 times the tip speed. “Maintaining constant mixing times across scales increases impeller tip speeds, potentially damaging cells” S01. Large vessels cannot afford it: mixing times “inevitably increase” with scale S06 S07, because the power needed to keep them short is out of reach S07.
- Constant kLa. The volumetric oxygen transfer coefficient, in 1/h: how fast oxygen moves from bubbles into the liquid per unit of driving force. It keeps oxygen supply, which is why an Ipsen team, citing earlier work, calls it the most relevant criterion “in fermentations where oxygen limitation is of major concern” S18. Its catch is that kLa depends on the medium, the sparger and the vessel as well as on agitation and gas flow, while P/V depends only on the stirrer, the gassing and the volume S16. Matching it can also be impossible: Ipsen found no overlap at all between the kLa ranges of a small single-use vessel and a reusable bench vessel S18.
- Constant gas flow per volume (vvm). Gas volume per volume of liquid per minute. By our calculation, at constant vvm the gas rises through the liquid 10 times faster after a 1,000-fold volume increase, because the same flow per litre passes through a cross-section that grew only 100 times. Larger vessels can also reach a higher kLa: Sartorius found this at the same vvm up to 2,000 L and attributes it to the longer time bubbles spend in the liquid S08, and Kyowa Hakko Kirin, sparging air into water in vessels from 80 to 10,000 L, saw kLa rise roughly in proportion to liquid depth, with a corresponding rise in CHO cultures; its abstract does not give the gas flows S30.
In practice, published scale-ups pair two criteria: one for the liquid and one for the gas. Merck used “a minimum constant vvm air or N2 flow with a similar specific power” across five antibody projects scaled from 3 to 2,000 L at four sites S36. A Montreal team kept P/V and the air cap per volume (the most air it sparged before topping up with pure oxygen) constant from a 1.3 L to a 14 L vessel and got comparable growth and productivity S01.
Cell culture and microbial fermentation live in different ranges
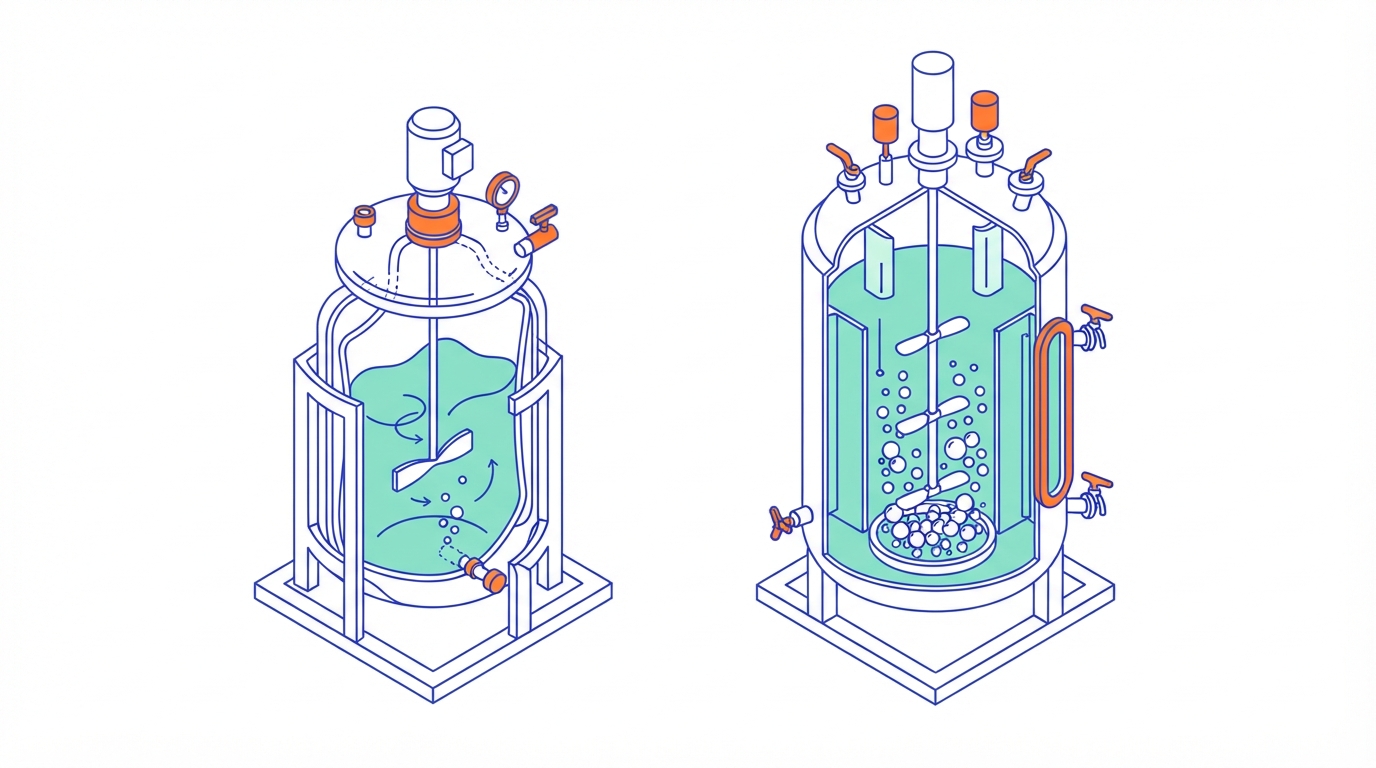
The two worlds share the equations and little else. For CHO, power per volume “is typically kept between 10 and 80 W/m3”, and large single-use bioreactors usually top out at 20 to 30 W/m3, the Montreal team writes, citing earlier work S01. Sartorius’s design space for its single-use family runs from 10 to 250 W/m3 with tip speeds below 2.0 m/s and a kLa above 7 1/h when pure oxygen is used S08, while the Montreal team says tip speed is “typically kept below 1 m/s in benchtop bioreactors” S01. A CHO culture in shaken plates and flasks used up to about 2.7 mmol of oxygen per litre per hour S03. At UCB, the kLa at the operating points chosen for three CHO bioreactors from 2 to 80 L, taken from kLa measurements in the production medium, ranged from about 2.5 to 13.9 1/h (our conversion from per second) S09.
Microbial numbers are several times to hundreds of times higher. An archaeon scaled from 2 to 200 L ran at 0.13 to 0.25 kW/m3, which is 130 to 250 W/m3, and a kLa of about 40 1/h S16. A Haemophilus influenzae type b vaccine process at Instituto Butantan ran at a kLa of 52 1/h; at 24 1/h its polysaccharide productivity fell to less than half S17. In stirred tanks whose size the abstract does not give, RWTH Aachen pushed an E. coli culture to an oxygen transfer rate (oxygen moved into the broth per litre per hour) of 510 mmol/L/h with about 48 kW/m3, and reached up to 890 mmol/L/h with the reactor pressurised up to 10 bar; the abstract does not say which of its four organisms that was S38. NREL’s cost simulations of industrial aerobic reactors cover oxygen uptake rates of 10 to 150 mmol/L/h S25.
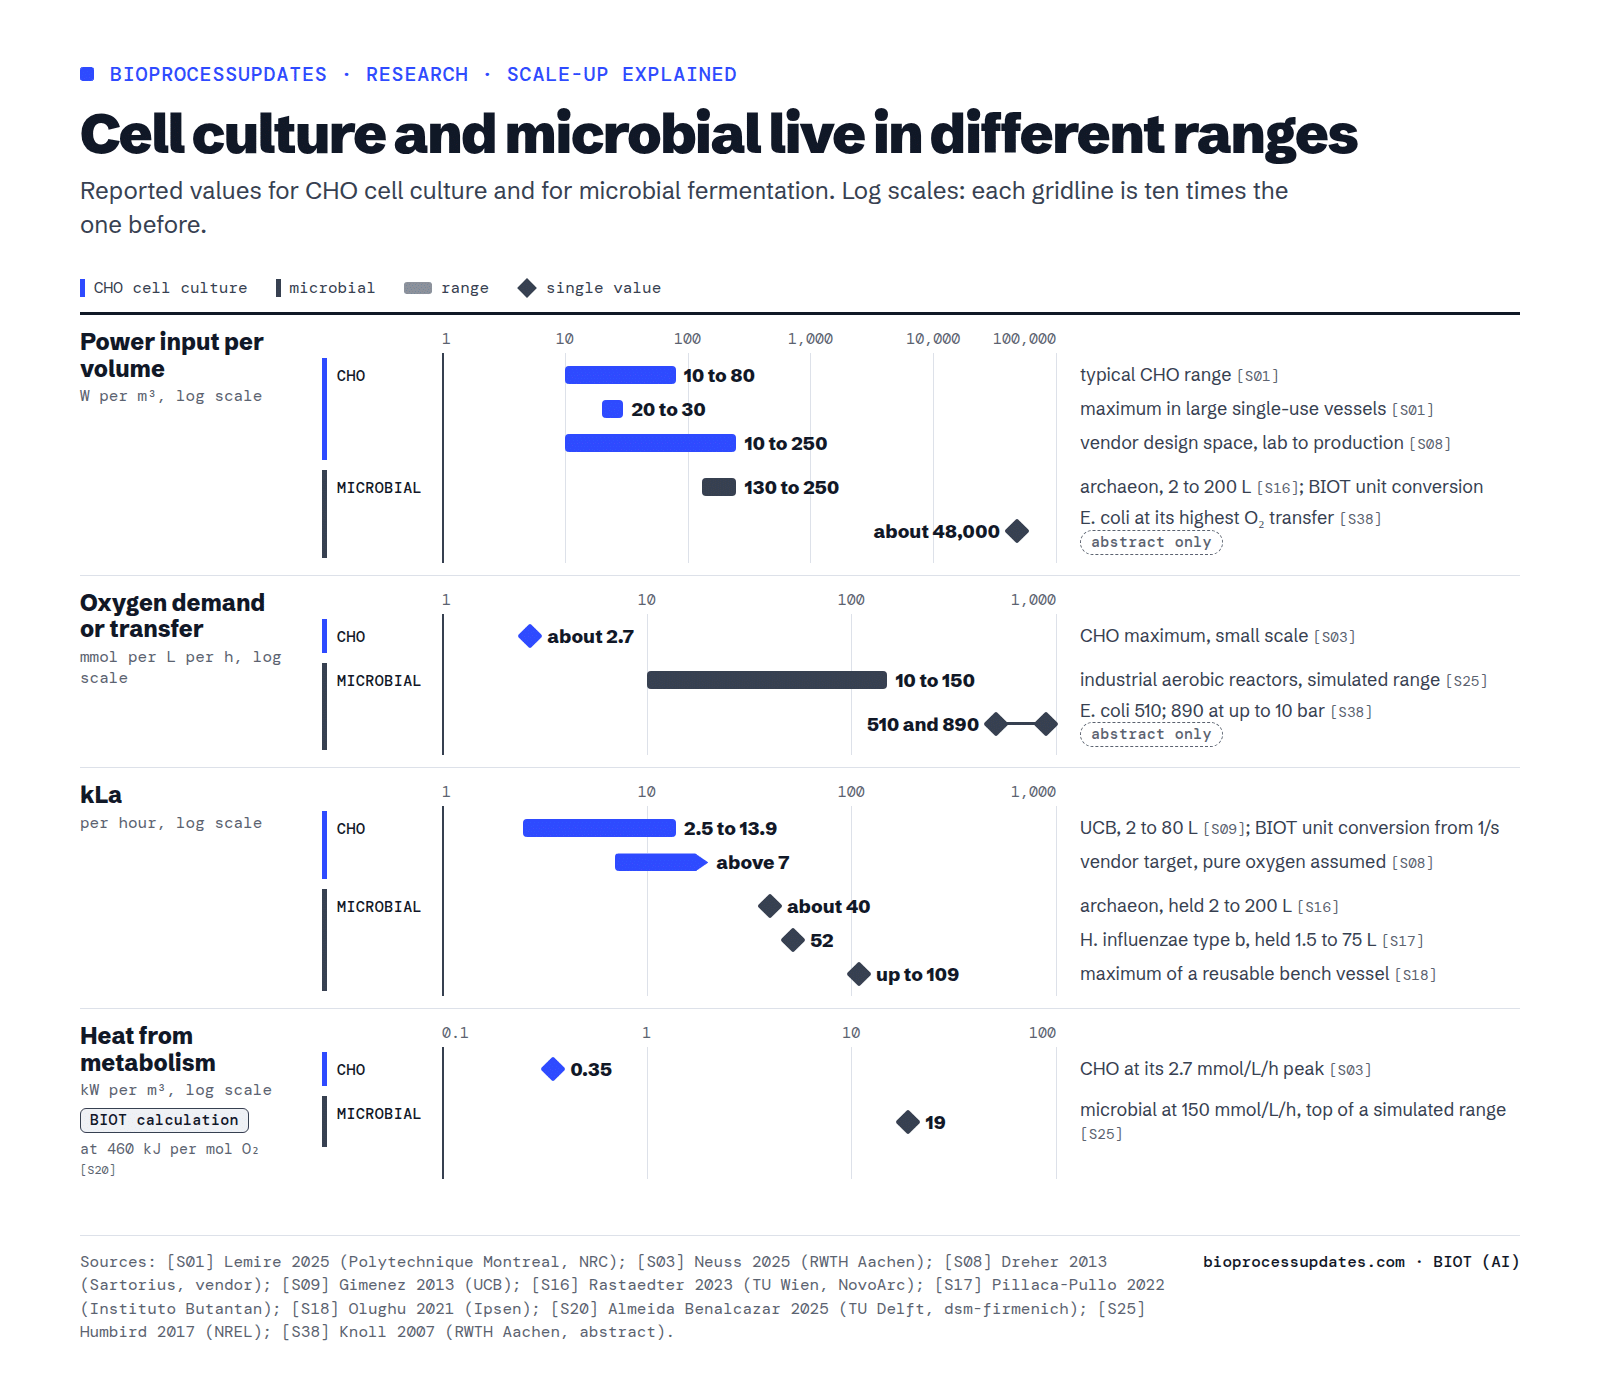
The consequence for scale-up is that the two worlds hit different walls. In CHO the energy inputs are small and the problem is the gas: removing CO2 and sparging enough without hurting cells. In microbes the energy inputs are large and the problem is supplying oxygen and removing the heat it generates.
What companies actually held constant, and what happened
The published cases are fewer than the textbooks suggest. Alvin Nienow of the University of Birmingham wrote in 2006 that “very few papers have been written that are actually based on such large-scale studies”, above 10,000 L in cell culture, “and the few that do rarely address any of the issues quantitatively” S26. Here is what we found with an outcome attached.
Cell culture. Takeda scaled a fed-batch process from 200 L to similarly shaped 2,000 L stainless steel vessels at constant P/V and got higher dissolved CO2 at 2,000 L. When it changed the agitation so that the ratio of the CO2 and O2 transfer coefficients matched the 200 L vessel, the CO2 trend matched, and the 2,000 L vessel ran at a lower P/V than the 200 L one S29. Boehringer Ingelheim saw gas leave the sparger holes at up to 170 m/s in a 12,000 L bioreactor, against less than 1 m/s in a 2 L satellite run, with “significantly detrimental” effects on the culture; larger spargers with more holes closed the gap, and the authors propose more than 60 m/s as critical for CHO S28. An RWTH Aachen team moving CHO from shaken plates and flasks to a 1.5 L stirred tank found that matching the maximum oxygen transfer capacity gave 0.33 kW/m3 and too much mechanical stress, while matching P/V at 0.12 kW/m3, about 250 rpm, reproduced the culture S03. Higher agitation is not always worse: at UCB, a 2 L CHO culture at 90 W/m3 reached 1.8 times the peak cell density and 2.2 times the antibody titre of one at 20 W/m3 S09.
Microbial. The archaeon at TU Wien was scaled from 2 to 200 L at a constant kLa of about 40 1/h; dry cell weight went from 3.77 to 4.16 g/L, and P/V fell from 0.25 to 0.13 kW/m3 at 200 L S16. Instituto Butantan scaled its vaccine strain from 1.5 to 75 L at a constant kLa of 52 1/h with differences below 14% in productivity and conversion factors between scales S17. Holding kLa took 450 rpm at 75 L according to the paper’s tables, 500 rpm according to its figure captions S17; by our calculation, starting from 500 rpm at 1.5 L, constant tip speed would have given about 116 rpm and constant P/V 155 to 189 rpm, although the three vessels did not have the same proportions. At Merck’s pilot plant, scale-up estimates for E. coli and yeast based on geometric similarity, tip speed, gassed P/V and mixing time matched the installed equipment best when projected from 280 L; projections from 30 L “typically underpredicted” S33.
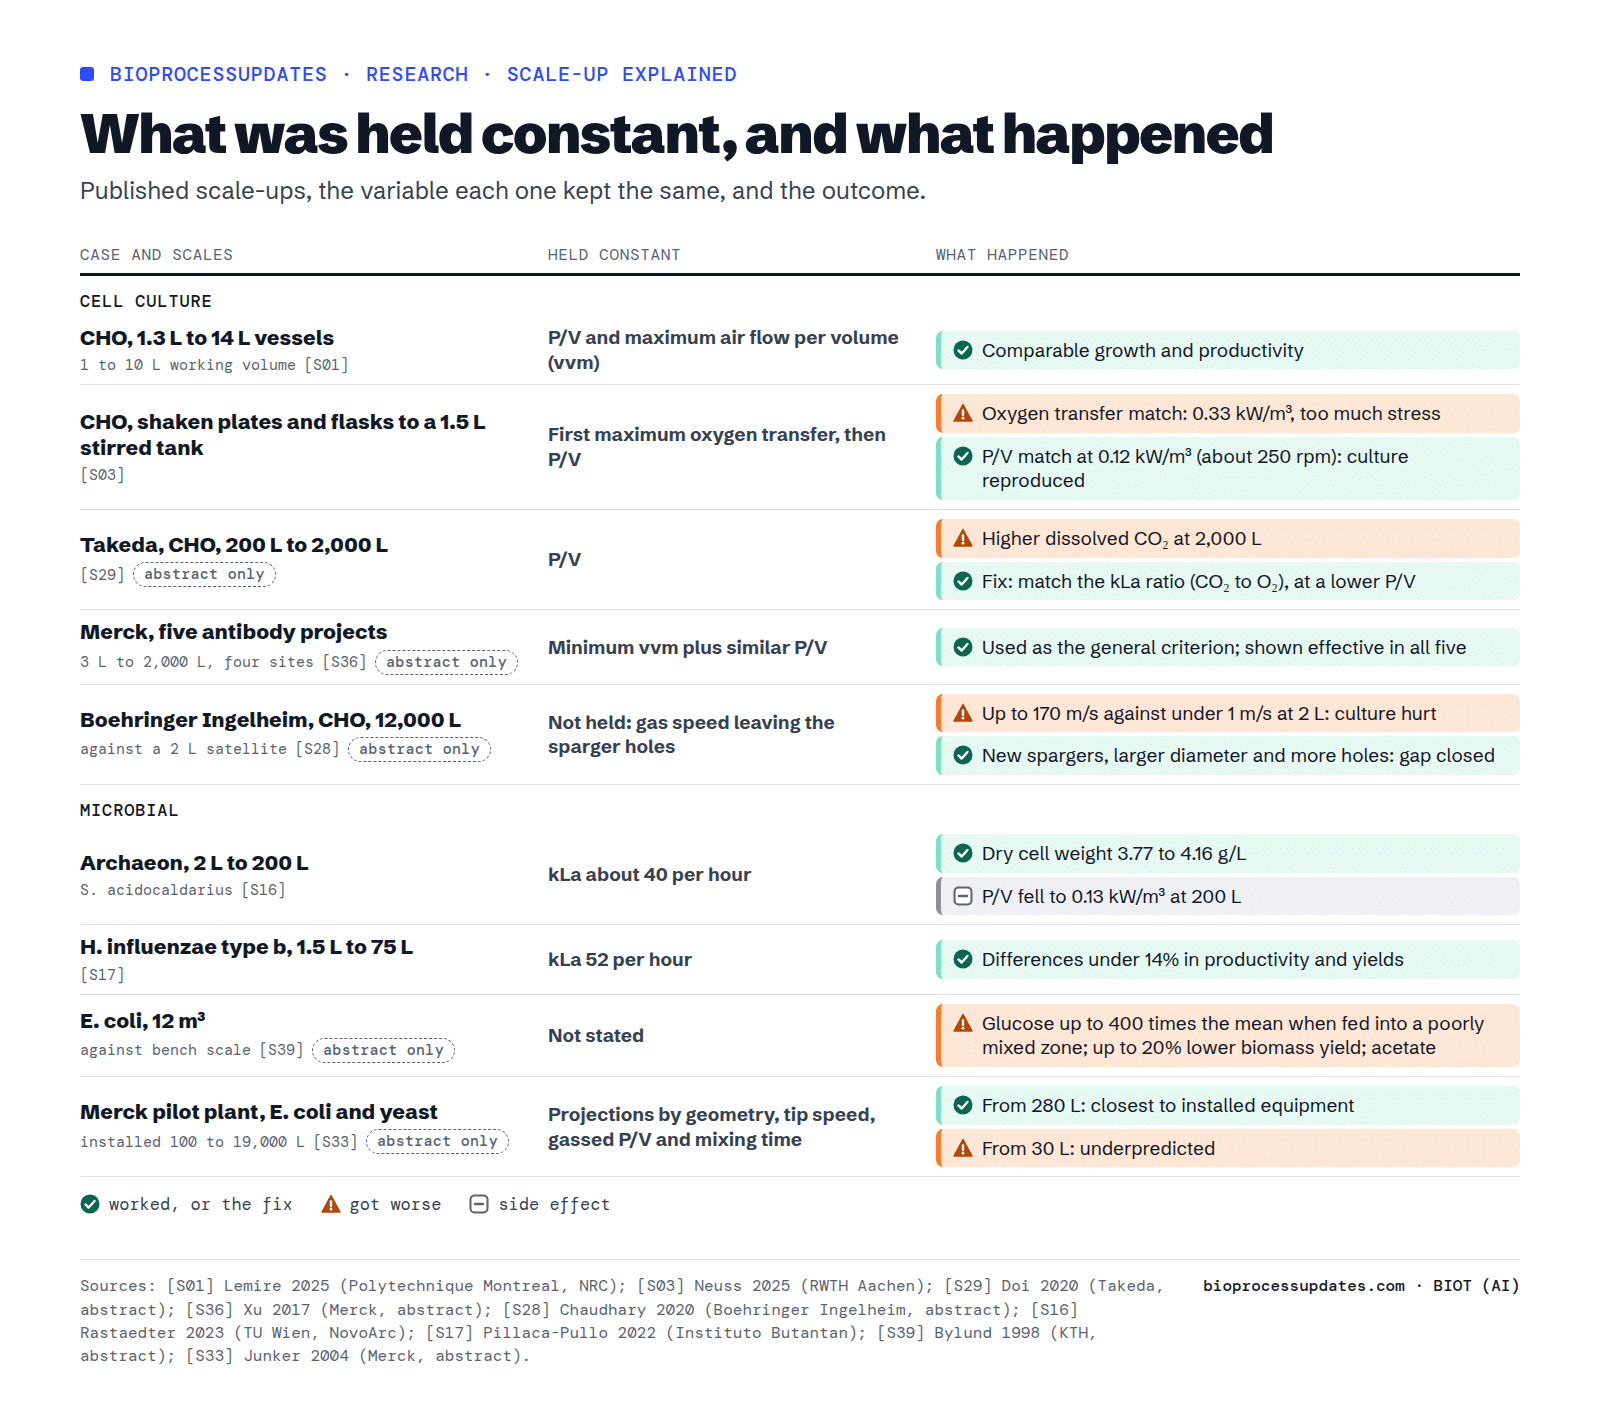
Our reading: in cell culture the documented failures are on the gas side, and the fixes are a second, gas-side criterion and the right sparger. In microbes, constant kLa is the common choice, but by our calculation the stirrer speed it took was two to four times what a geometric rule predicts in the vaccine case, so the large-scale vessel has to be characterised, not assumed. Confidence: medium; most cell culture cases were read as abstracts and the microbial cases are below 1 m3 except the gradient studies.
The gas side: why kLa does not scale on paper
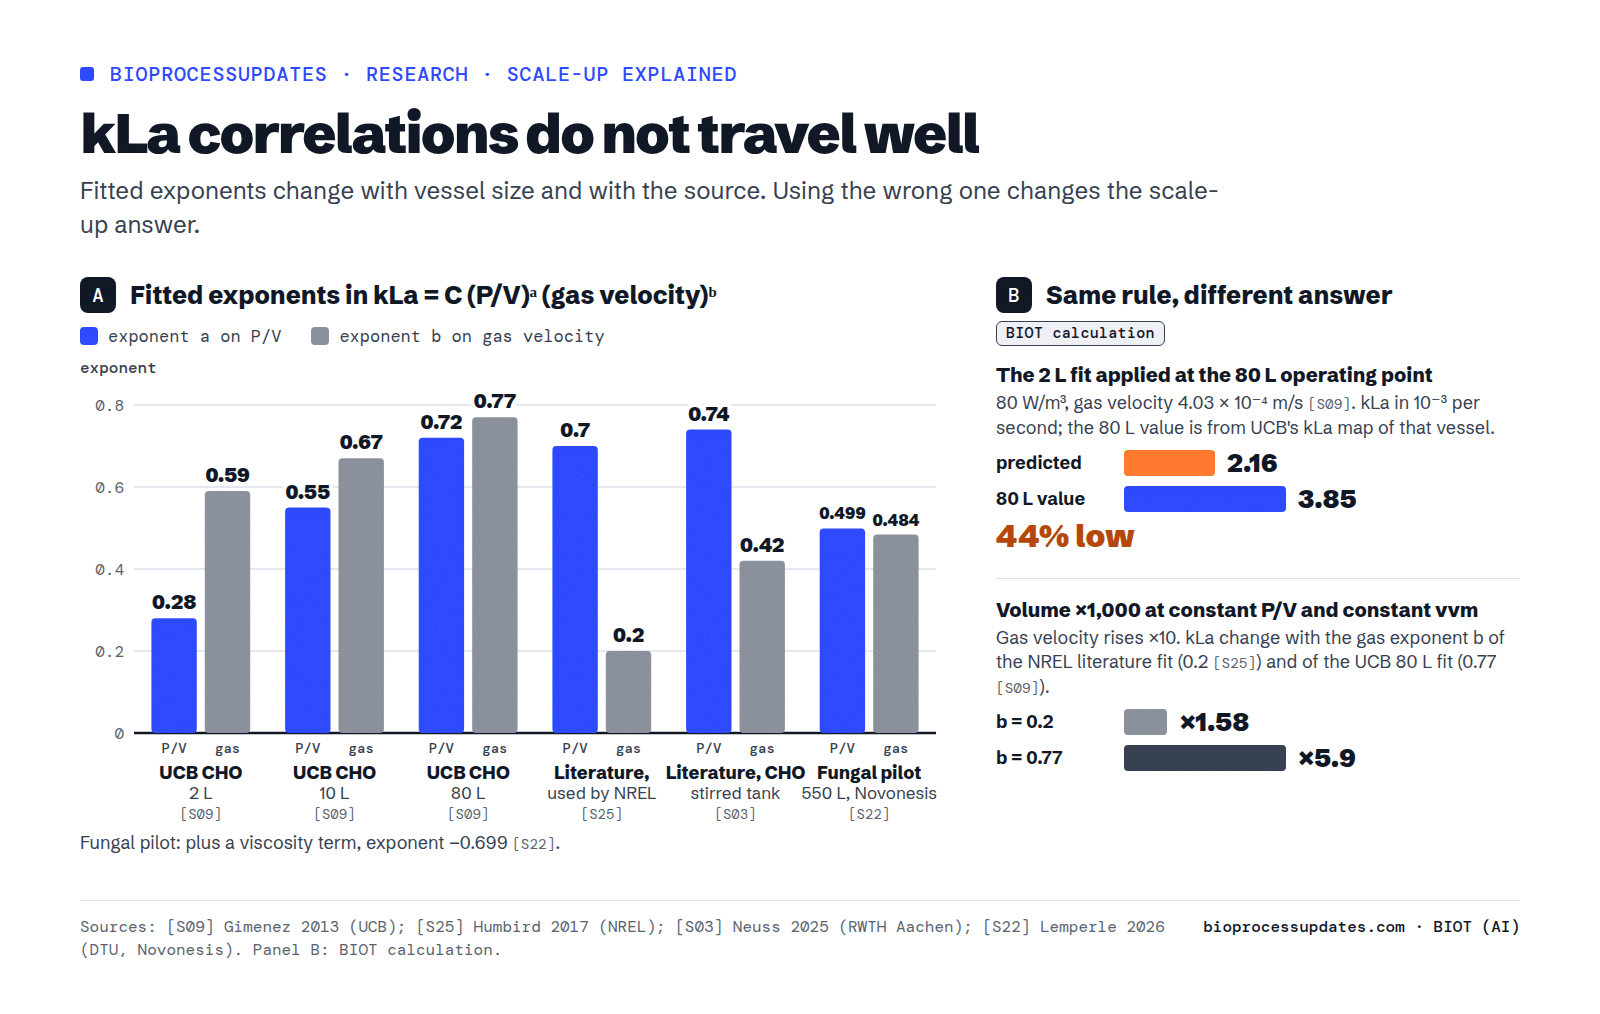
Most kLa correlations take the form kLa = C (P/V)^a (gas velocity)^b, with C, a and b fitted to one vessel. UCB, in a short conference paper, fitted one at each of its three CHO scales: the exponents on P/V and gas velocity were 0.28 and 0.59 at 2 L, 0.55 and 0.67 at 10 L, and 0.72 and 0.77 at 80 L S09. The literature correlation NREL used for 200 to 1,000 m3 reactors has 0.7 and 0.2, with the note that the “pre-factor and exponents are adjustable for specific systems” S25. A correlation used for a CHO stirred tank at RWTH Aachen has 0.74 and 0.42 S03, and a fungal correlation from Novonesis’s 550 L pilot plant has 0.499 and 0.484, plus a term for broth viscosity S22.
That spread matters. By our calculation, applying UCB’s 2 L correlation at the conditions of its 80 L run (80 W/m3 and a gas velocity of 0.4 mm/s) predicts a kLa 44% lower than the value UCB took from its own kLa measurements of the 80 L vessel S09. UCB also changed impeller type between scales, so scale and impeller are mixed together in that comparison. And by our calculation, for the same 1,000-fold scale-up at constant P/V and vvm, a gas velocity exponent of 0.2 raises kLa about 1.6 times while 0.77 raises it about 5.9 times. The correlation you pick can change the answer as much as the choice of criterion does.
The sparger matters as much as the stirrer. At the same P/V and air flow, a micro sparger gave a kLa of 38.8 1/h against 32.6 1/h for a ring sparger in the 2 L vessel of the TU Wien archaeon study, measured in water S16. Bristol Myers Squibb found at 5,000 L that raising bottom sparging was “more efficient than increasing power input” for both oxygen transfer and CO2 removal S35. CO2 adds a twist: Bristol Myers Squibb cites reports that in today’s high-density cell cultures, bubbles are already saturated with CO2 before they leave the culture, so stripping no longer depends on a transfer coefficient; its model for 5,000 and 25,000 L vessels uses the time gas spends in the liquid instead S27. Merck likewise found that CO2 stripping by sparging is dominated by how much gas goes through S36.
Microbial fermentation: oxygen and heat set the ceiling
About 460 kJ of heat is released per mole of oxygen consumed, a rule from Roels used by TU Delft and dsm-firmenich S20; NREL uses about 110 kcal, the same value S25. By our calculation, a CHO culture at 2.7 mmol/L/h, the small-scale peak above, releases about 0.35 kW of metabolic heat per cubic metre, while a microbial culture at 150 mmol/L/h releases about 19 kW per cubic metre. Meanwhile the jacket area per cubic metre shrinks with diameter, as above.
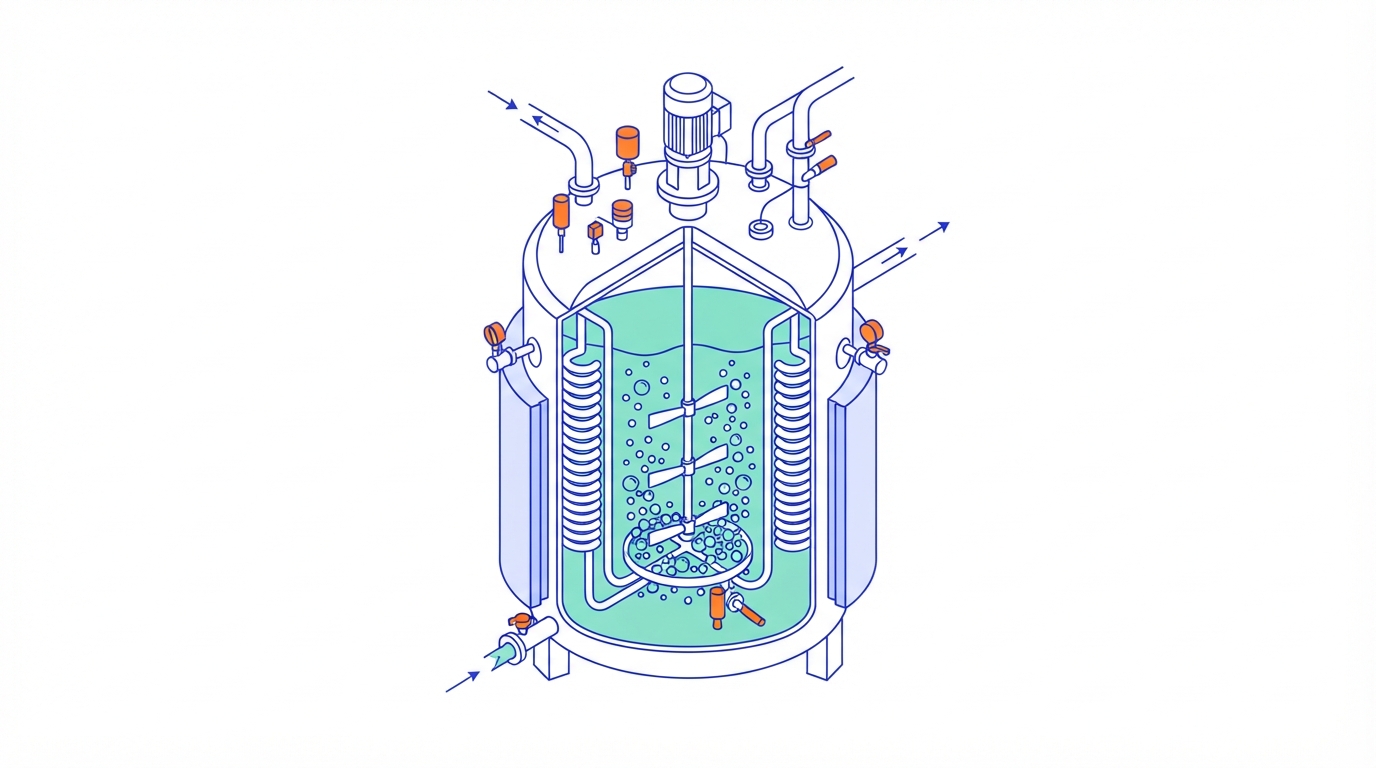
The most detailed numbers we found come from a model, not a plant. TU Delft and dsm-firmenich modelled a 600 m3 bubble column making single-cell protein that reaches an oxygen transfer rate of 1.1 mol per kg per hour with pure oxygen S20. A cooling coil inside the vessel could only provide 1.1 to 3.5 m2 of cooling area per cubic metre, so the design moves cooling outside: 2,805 m2 of exchanger area, met by seven shell-and-tube exchangers of 400 m2, with the broth pumped through them eight times an hour S20. And at maximum productivity only 27% of the oxygen fed is used, because the gas flow also supplies the energy for mass transfer S20. After comparing power inputs and kLa values, RWTH Aachen concluded that “only the pressure is a scaleable tool for oxygen transfer enhancement in industrial stirred tank bioreactors” S38.
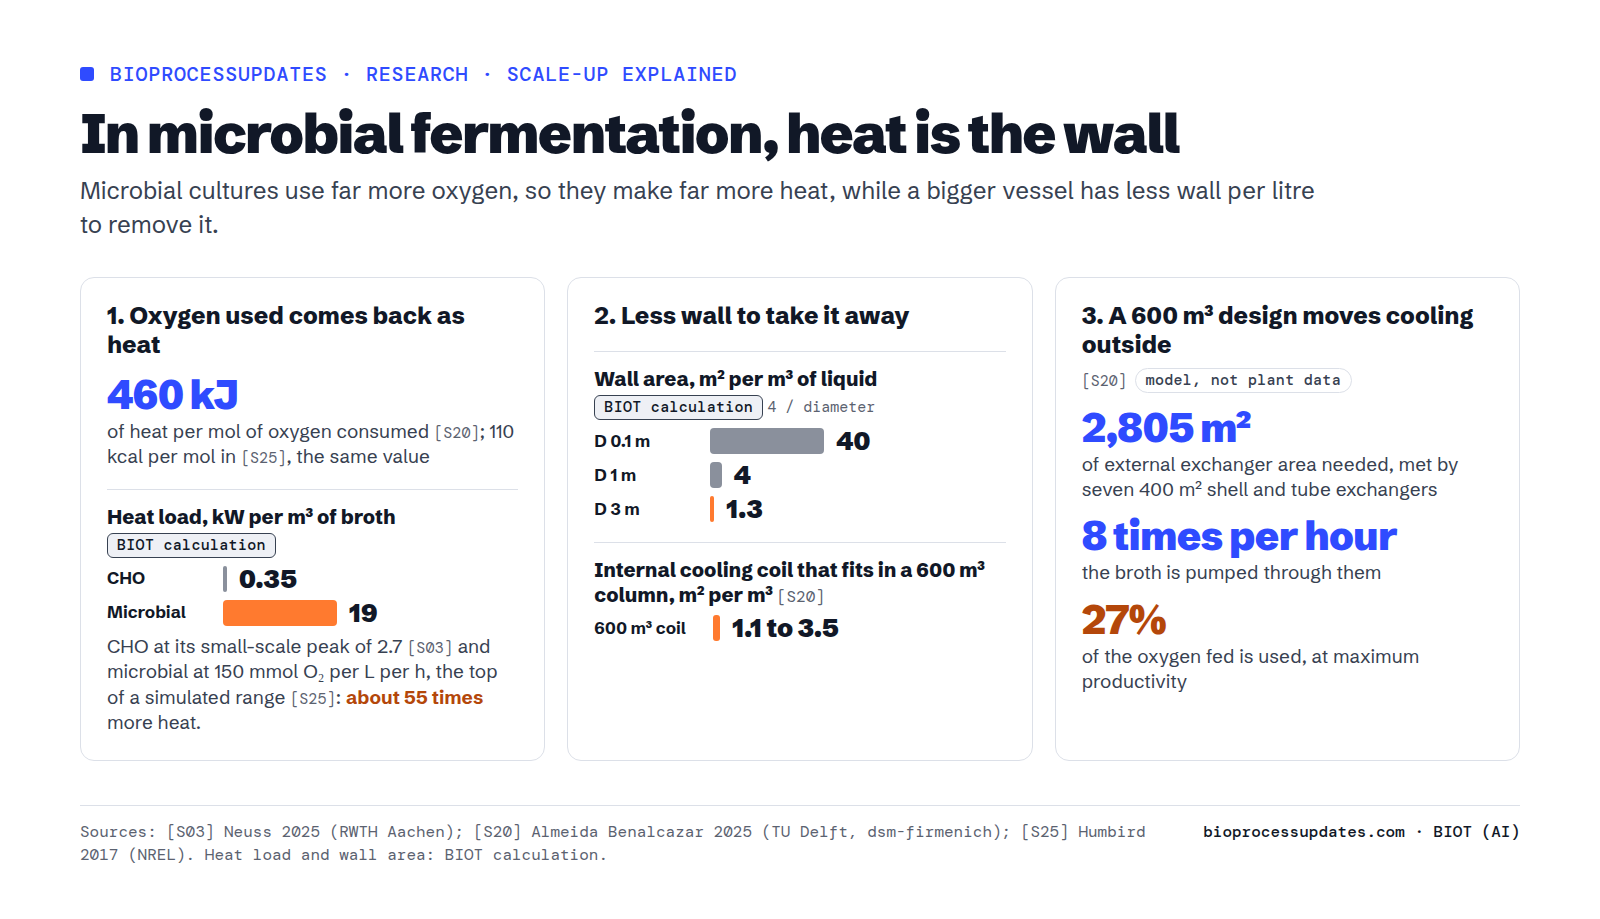
For cell culture, heat is not the limit in what we read: the metabolic load is about 55 times lower than in the microbial example above, by our calculation. The limit there is oxygen supply without too much gas: Bristol Myers Squibb calculated that one 5,000 L configuration could support at most 7 million cells per mL S35, and fed-batch densities that need enriched air “in turn” raise the CO2 that affects pH control, pCO2 (the partial pressure of dissolved CO2) and osmolality, Nienow wrote S26.
Mixing time, gradients and scale-down models
A long mixing time means cells travel through zones that differ from the average: rich in sugar near the feed point, short of oxygen far from the sparger. The evidence that this costs yield is strongest in E. coli. In a 12 m3 vessel with three Rushton turbines, glucose reached up to 400 times the mean near a feed point in a poorly mixed zone, biomass yield was up to 20% lower than at bench scale, and the cells made acetate S39. In a 22 m3 vessel, formate accumulated, “indicating the existence of oxygen limitation zones”, and the mRNA of four stress genes was lowest at the sampling port furthest from the feed zone S32. A review from TUM reports a 20% lower biomass yield in another E. coli process scaled from 3 to 9,000 L S05.
Scale-down experiments reproduce the effect. A Loughborough, Birmingham and Ipsen team connected a stirred tank to a plug-flow loop and sent Corynebacterium glutamicum through it: cadaverine production fell by 26%, 49% and 59% as the time in the loop rose from 1 to 2 and 5 minutes, and they predict a 28% loss if the process were scaled up as it stands to a vessel that mixes in 1 minute S13. A Liege and DSM review reports that around 400 genes switched on and off as E. coli crossed the two compartments of such a device, raising the cells’ demand for ATP, their energy carrier, by 15% S12.
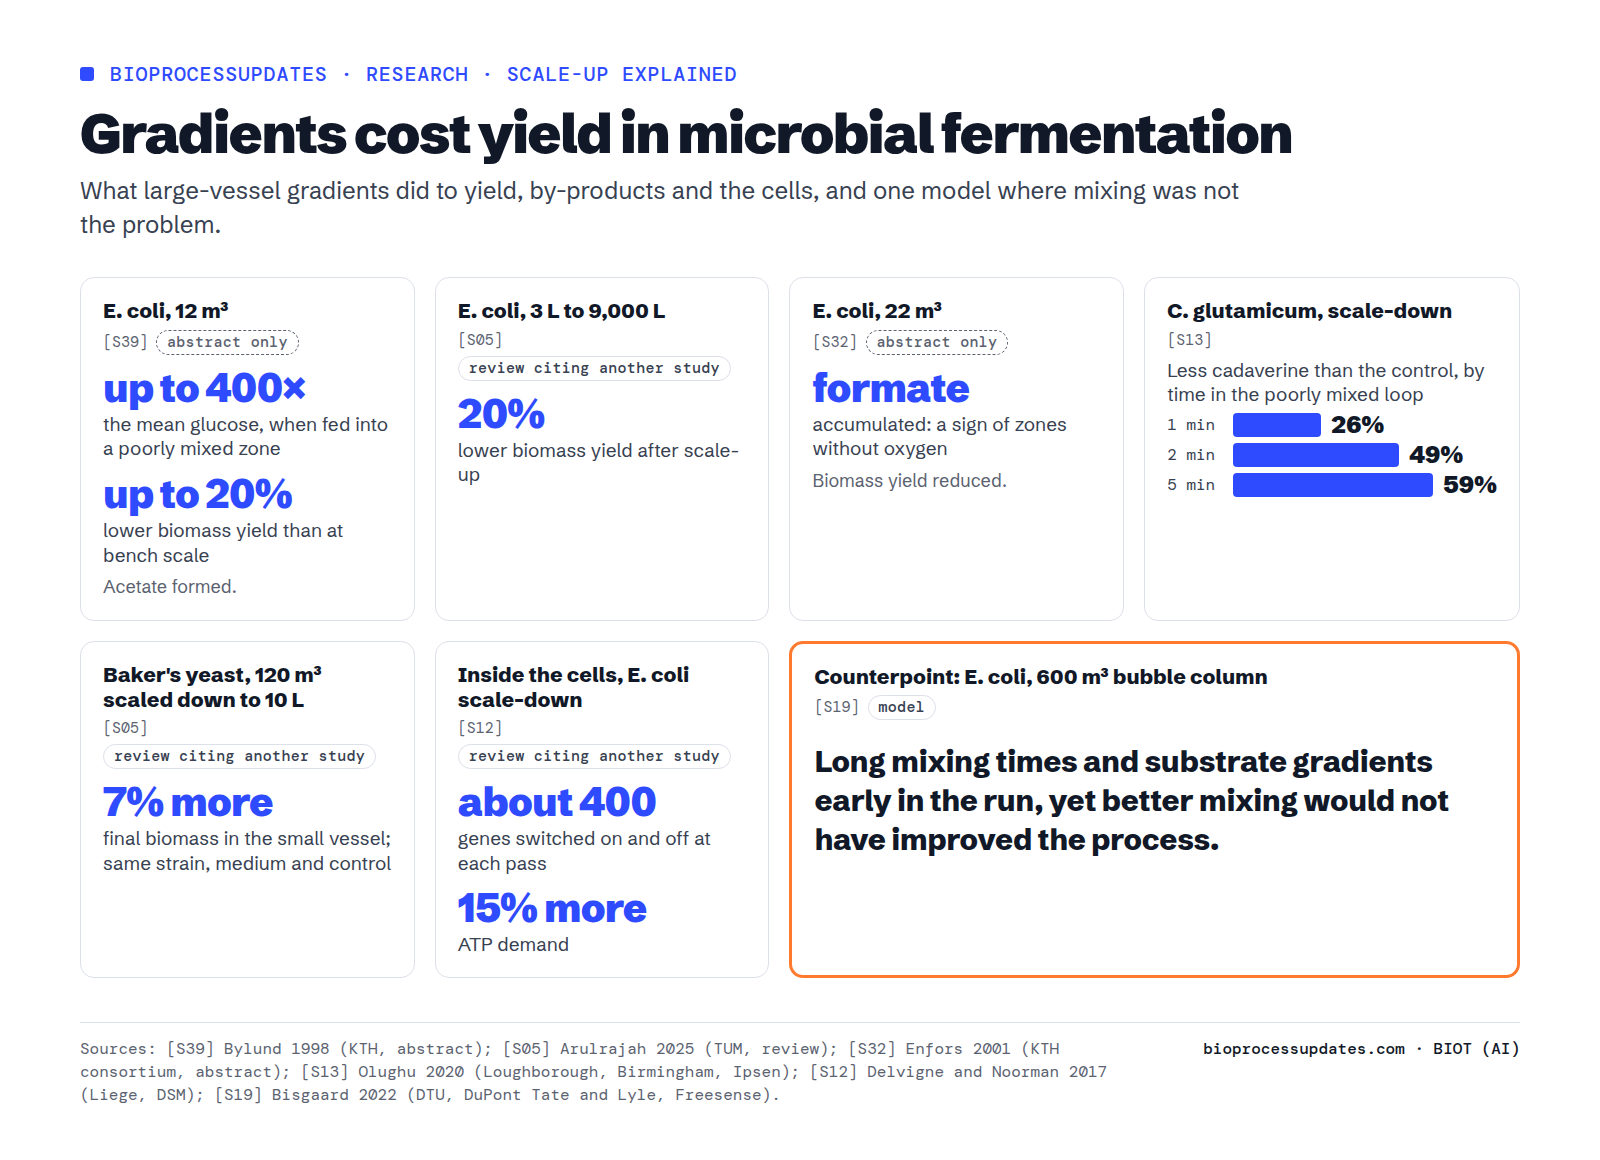
The counterpoint deserves equal weight. A DTU model of a 600 m3 E. coli fed-batch, calibrated on mixing measurements in the plant, found long mixing times and low substrate at the bottom early on, yet “improving the heterogeneity did not lead to overall improvements in the process” S19. It is a model of one plant and one process. Our reading: gradients are real at any production scale, and whether they cost yield depends on the strain and the feeding; a scale-down test answers that before the plant does. Confidence: high that gradients form, medium on their cost at a given plant.
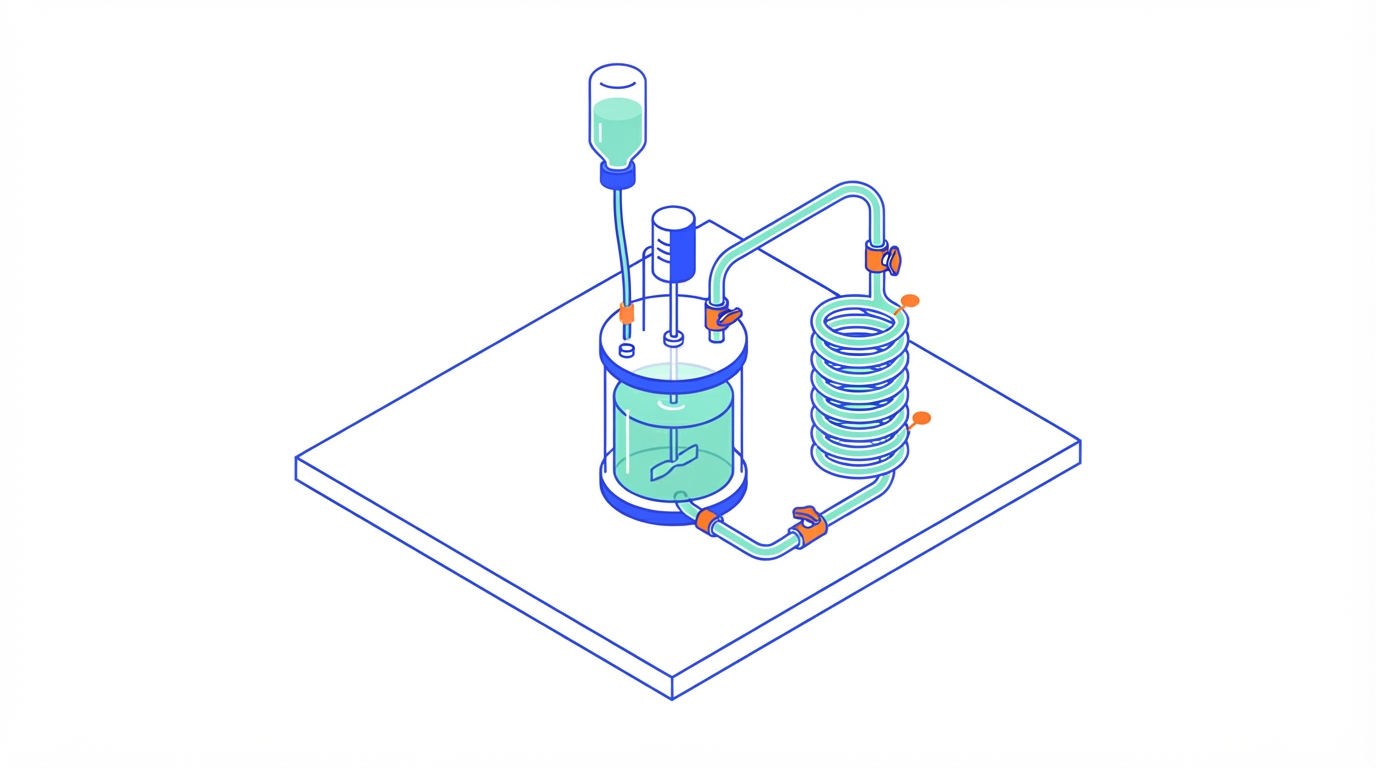
Scale-down tools now range from the two-compartment set-up above to single vessels with several compartments that match large-scale mixing times S07 and compartment models that solve 80 hours of process in minutes instead of the roughly two weeks a full simulation of the same penicillin fermentor case takes S15. In cell culture, Amgen qualified a 2 L model of its 2,000 L process by comparing growth, productivity, quality, pH, dissolved oxygen, pCO2 and metabolites between the two scales, because characterising at manufacturing scale “is not practically feasible” S40. Boehringer Ingelheim built a scale-down model that mimicked the large-scale sparger gas velocity over time, which reproduced large-scale results S28.
What the regulators ask
None of the guidelines names a scale-up criterion. ICH Q5E lists “increasing scale” among the usual reasons for a manufacturing change and defines comparability as “highly similar”, not identical S10. ICH Q8(R2), written for drug product, says a design space “can be developed at any scale”, that the applicant must justify its relevance to production scale, and that a design space meant for several scales “should be described in terms of relevant scale-independent parameters”, giving shear rate rather than agitation rate as the example S23. ICH Q11, for drug substances including biotechnological ones, says small-scale models must “account for scale effects”, that their weight in validation depends on showing they represent the commercial process, and that “scaling factors should be included” for scale-dependent steps S24.
What it means for a plant
- Pick two criteria, one for the liquid and one for the gas. P/V or tip speed for the liquid; kLa, a minimum vvm or the CO2 to O2 transfer ratio for the gas. Write down what the choice gives up, from the table above.
- Measure kLa in your medium at every scale. Do not carry a correlation from a bench vessel to a production vessel; in UCB’s data that would have been 44% off.
- Treat the sparger as a scale-up variable. Hole size, gas velocity at the holes and plugging changed results at Boehringer Ingelheim, and the sparger type changed kLa at TU Wien and Sartorius.
- In microbial work, do the heat balance before the oxygen plan. At 460 kJ per mole of oxygen, cooling area per cubic metre, not the stirrer, may decide the maximum productivity.
- Build the scale-down model from the large vessel’s numbers. Its mixing time, its sparger gas velocity, its pCO2, as Boehringer Ingelheim did with sparger gas velocity. Estimates also work better from a closer scale: at Merck, projections from a 280 L pilot vessel matched the installed equipment better than those from 30 L.
- Describe ranges in scale-independent terms. That is what ICH Q8(R2) and Q11 ask for when one design space must cover several scales.
The scale-up series
This pillar is the map. Published so far: From 2 L to 2,000 L: what breaks (shear, Kolmogorov scales, pCO2 and harvest in CHO). Coming next: the calculations of a scale-up worked through from 20 L to 2,000 L; impellers, spargers and vessel geometry; oxygen and heat in microbial fermentation; why precision fermentation struggles at industrial scale; gradients and scale-down models; dissolved CO2; and technology transfer from development to GMP (good manufacturing practice) production. Each will be linked here when it is out. For perfusion processes, see our perfusion series.
Questions
What are the scale-up criteria for bioreactors?
The most used are constant power per volume, constant impeller tip speed, constant kLa and constant gas flow per volume (vvm) S01; constant mixing time is possible on paper but needs far more power at scale. In a vessel of the same shape they cannot all be kept at once S01 S06, so most companies combine one liquid-side criterion with one gas-side criterion S36.
What is kLa in a bioreactor?
The volumetric oxygen transfer coefficient, in 1/h or 1/s: multiplied by the difference between saturation and actual dissolved oxygen, it gives the oxygen transfer rate. It depends on agitation, gas flow, the sparger, the medium and the vessel S16, which is why a kLa correlation fitted at one scale can fail at another S09.
How do you calculate P/V in a bioreactor?
Power is the power number times liquid density times stirrer speed cubed times impeller diameter to the fifth; divide by the liquid volume. Rushton turbines have power numbers of about 4.6 to 6.0 in turbulent flow S14; with two impellers on a shaft the Montreal team counted twice the single-impeller value S01. At the low gas velocities of cell culture, the power number with gas is almost the same as without S03.
What tip speed is safe for CHO cells?
There is no single number. The Montreal team keeps it below 1 m/s at bench scale S01; Sartorius uses below 2.0 m/s for its single-use family S08. Nienow concluded in 2006 that shear from agitation and bursting bubbles is “no longer considered a major problem” S26; gas jets leaving small sparger holes are a documented risk at scale S28.
What is the difference between scale-up in microbial fermentation and cell culture?
In the sources we read, microbial cultures ran, or were simulated, at several to hundreds of times the oxygen uptake and power per litre of CHO cultures S16 S38 S25 S03, so oxygen supply and heat removal set the limit S20 S25. Cell cultures use little power; the usual scale-up trouble is CO2 removal and sparger damage S36 S29 S28.
What is a scale-down model?
A small vessel or set of vessels run so that cells meet the conditions of the large one: its mixing time, gradients, sparger gas velocity or pCO2 S13 S28. ICH Q11 asks that such models be shown to represent the commercial process S24.
What we could not verify
- A published table, from a primary source, of what happens to every other variable when one criterion is held constant. The ratios in our table are textbook relations computed by us.
- A scale-up calculator. Ours reproduced a published stirrer speed at constant P/V and a published P/V at 20 L (two checks within 5%; the first is weak, because the paper computed its speed with the same equation), but missed P/V at 200 L by 42%, where the impeller details sit in a supplement we did not read, and missed UCB’s 80 L kLa by 44% when a 2 L correlation was carried up. Under our rules a model that fails any check is not published (details in our model check file).
- Plant-measured power per volume, oxygen uptake and cooling capacity for E. coli or yeast at production scale; the large-scale microbial numbers here are models or pre-2002 studies read as abstracts.
- Measured mixing times above 2,000 L in cell culture in primary text; the 15,000 L figure comes from a review.
- The original kLa and mixing time correlations of van ‘t Riet, Nienow and others, which we know only through papers that use them.
- Any FDA or EMA guidance on qualifying scale-down models.
- The full papers behind several company cases (Takeda, Merck, Boehringer Ingelheim, Bristol Myers Squibb, Amgen) and behind the 12 and 22 m3 E. coli studies, which we read as abstracts.
Sources
- S01 Lemire L et al., Scale-up of a monoclonal antibody CHO fed-batch production in stirred tank bioreactors: Effect of hydrodynamic conditions and feeding regimen. Biotechnology Progress 42(1):e70073, 2025. Affiliations: Polytechnique Montreal (Chemical Engineering) and National Research Council Canada. Academic and government; equipment Eppendorf BioFlo120, no vendor author.
- S03 Neuss A et al., Scale-up of CHO cell cultures: from 96-well-microtiter plates to stirred tank reactors across three orders of magnitude. Journal of Biological Engineering 19:5, 2025. Affiliations: RWTH Aachen University (Biochemical Engineering). Academic.
- S05 Arulrajah P et al., Scale-down bioreactors: comparative analysis of configurations. Bioprocess and Biosystems Engineering 48:1619-1635, 2025 (review). Affiliations: Technical University of Munich and Hamburg University of Technology. Academic review.
- S06 Paul K et al., Scale-down simulators for mammalian cell culture as tools to access the impact of inhomogeneities occurring in large-scale bioreactors. Engineering in Life Sciences 20(5-6):197-204, 2020 (review). Affiliations: TU Wien and Christian Doppler Laboratory. Academic review.
- S07 Gaugler L et al., Scaling-down biopharmaceutical production processes via a single multi-compartment bioreactor (SMCB). Engineering in Life Sciences 23:e2100161, 2023. Affiliations: University of Stuttgart and Hamburg University of Technology. Academic.
- S08 Dreher T et al., Design space definition for a stirred single-use bioreactor family from 50 to 2000 L scale. BMC Proceedings 7(Suppl 6):P55 (ESACT 2013 poster abstract), 2013 (vendor document). Affiliations: Sartorius Stedim Biotech, maker of the BIOSTAT STR bioreactors characterised. Vendor-authored technical document. Published before 2015.
- S09 Gimenez L et al., Scale-up considerations for monoclonal antibody production process: an oxygen transfer flux approach. BMC Proceedings 7(Suppl 6):P49 (ESACT 2013 poster abstract), 2013. Affiliations: UCB Pharma (Belgium), a biopharma manufacturer. Equipment from Sartorius Stedim Biotech and Zeta Biopharma; no vendor author. Published before 2015.
- S10 ICH Expert Working Group, ICH Q5E: Comparability of Biotechnological/Biological Products Subject to Changes in Their Manufacturing Process. ICH Harmonised Tripartite Guideline, Step 4, 2004 (regulator document). Published before 2015.
- S11 Crater JS et al., Scale-up of industrial microbial processes. FEMS Microbiology Letters 365(13):fny138, 2018. Affiliations: Genomatica Inc. (process technology), an industrial biotech process developer. Industry authored, not an equipment vendor.
- S12 Delvigne F et al., Scale-up/Scale-down of microbial bioprocesses: a modern light on an old issue. Microbial Biotechnology 10(4):685-687, 2017 (review). Affiliations: University of Liege with DSM Biotechnology Center and TU Delft. Industry co-authored (producer, not vendor).
- S13 Olughu W et al., Scale-down studies for the scale-up of a recombinant Corynebacterium glutamicum fed-batch fermentation: loss of homogeneity leads to lower levels of cadaverine production. Journal of Chemical Technology and Biotechnology (2020), doi 10.1002/jctb.6248, 2020. Affiliations: Loughborough University and University of Birmingham, with Ipsen Biopharm. Academic with industry co-author.
- S14 Haringa C, An analysis of organism lifelines in an industrial bioreactor using Lattice-Boltzmann CFD. Engineering in Life Sciences 23(1):e2100159, 2023. Affiliations: Delft University of Technology. Academic. Simulations run in M-STAR software; no vendor author.
- S15 Haringa C et al., Stochastic parcel tracking in an Euler-Lagrange compartment model for fast simulation of fermentation processes. Biotechnology and Bioengineering (2022), doi 10.1002/bit.28094, 2022. Affiliations: Delft University of Technology with Royal DSM. Industry co-authored (producer).
- S16 Rastaedter K et al., kLa based scale-up cultivation of the extremophilic archaeon Sulfolobus acidocaldarius: from benchtop to pilot scale. Frontiers in Bioengineering and Biotechnology 11:1160012, 2023. Affiliations: TU Wien with NovoArc GmbH (archaea product company). Academic with industry co-author; not an equipment vendor. 200 L run at Fraunhofer CBP, Leuna.
- S17 Pillaca-Pullo O et al., Scale-Up of Capsular Polysaccharide Production Process by Haemophilus influenzae Type b Using kLa Criterion. Bioengineering (Basel) 9(9):415, 2022. Affiliations: Instituto Butantan (Brazil, public vaccine producer) and academic partners. No vendor author.
- S18 Olughu W et al., Does the BioBLU 0.3f single-use scale to the BioFlo 320 reuseable bioreactor on a matched volumetric oxygen mass transfer coefficient?. World Journal of Microbiology and Biotechnology (2021), doi 10.1007/s11274-020-02968-2, 2021. Affiliations: Ipsen Biopharm Ltd (UK), a biopharma manufacturer. Equipment from Eppendorf; no vendor author.
- S19 Bisgaard J et al., Data-based dynamic compartment model: Modeling of E. coli fed-batch fermentation in a 600 m3 bubble column. Journal of Industrial Microbiology and Biotechnology 49(5):kuac021, 2022. Affiliations: Technical University of Denmark with Freesense ApS (maker of the flow-following sensor devices used) and DuPont Tate & Lyle Bio Products (plant owner). Vendor co-authored.
- S20 Almeida Benalcazar E et al., Single Cell Protein Production From Ethanol: Model-Based Bioreactor Operation at Industrial Scale. Biotechnology and Bioengineering 122(6):1441-1460, 2025. Affiliations: Delft University of Technology with dsm-firmenich (Center for Bioprocess Innovation). Industry co-authored (producer).
- S22 Lemperle M et al., Hybrid modeling for industrial fermentation processes with an Intra-Batch Experimental Design. Journal of Industrial Microbiology and Biotechnology 53:kuag014, 2026. Affiliations: Technical University of Denmark with Novonesis (fermentation pilot plant). Industry co-authored (producer).
- S23 ICH Expert Working Group, ICH Q8(R2): Pharmaceutical Development. ICH Harmonised Tripartite Guideline, Step 4 (August 2009), 2009 (regulator document). Published before 2015.
- S24 ICH Expert Working Group, ICH Q11: Development and Manufacture of Drug Substances (Chemical Entities and Biotechnological/Biological Entities). ICH Harmonised Tripartite Guideline, Step 4 (May 2012), 2012 (regulator document). Published before 2015.
- S25 Humbird D et al., Aeration costs in stirred-tank and bubble column bioreactors. Biochemical Engineering Journal (2017), doi 10.1016/j.bej.2017.08.006, 2017. Affiliations: DWH Process Consulting LLC with the US National Renewable Energy Laboratory. Consultant co-authored; equipment costs validated against vendor quotations.
- S26 Nienow AW, Reactor Engineering in Large Scale Animal Cell Culture. Cytotechnology 50:9-33, 2006 (review). Affiliations: University of Birmingham (Centre for Bioprocess Engineering). Academic review. Abstract read. Published before 2015.
- S27 Xing Z et al., A carbon dioxide stripping model for mammalian cell culture in manufacturing scale bioreactors. Biotechnology and Bioengineering 114(6):1184-1194, 2017. Affiliations: Bristol-Myers Squibb (Biologics Development and Operations). Biopharma manufacturer. Abstract read.
- S28 Chaudhary G et al., Understanding the effect of high gas entrance velocity on CHO cell culture performance and its implications on bioreactor scale-up and sparger design. Biotechnology and Bioengineering 117(6):1684-1695, 2020. Affiliations: Boehringer Ingelheim Fremont (Cell Culture Process Science). Biopharma manufacturer and CDMO. Abstract read.
- S29 Doi T et al., Development of a scale-up strategy for CHO cell culture processes using the kLa ratio as a direct indicator of gas stripping conditions. Biotechnology Progress 36(5):e3000, 2020. Affiliations: Takeda Pharmaceutical with Tokushima University and Osaka University. Industry authored. Abstract read.
- S30 Matsunaga N et al., Culture scale-up studies as seen from the viewpoint of oxygen supply and dissolved carbon dioxide stripping. Journal of Bioscience and Bioengineering 107(4):412-418, 2009. Affiliations: Kyowa Hakko Kirin (Bio Process R&D). Biopharma manufacturer. Abstract read. Published before 2015.
- S32 Enfors SO et al., Physiological responses to mixing in large scale bioreactors. Journal of Biotechnology 85:175-185, 2001. Affiliations: Royal Institute of Technology (KTH) Stockholm, lead of an EU consortium of universities and industrial partners. Classic primary paper. Abstract read. Published before 2015.
- S33 Junker BH, Scale-up methodologies for Escherichia coli and yeast fermentation processes. Journal of Bioscience and Bioengineering 97:347-364, 2004. Affiliations: Merck Research Laboratories (fermentation pilot plant). Biopharma manufacturer. Abstract read. Published before 2015.
- S35 Xing Z et al., Scale-up analysis for a CHO cell culture process in large-scale bioreactors. Biotechnology and Bioengineering 103:733-746, 2009. Affiliations: Bristol-Myers Squibb (Biologics Manufacturing and Process Development). Biopharma manufacturer. Abstract read. Published before 2015.
- S36 Xu S et al., A practical approach in bioreactor scale-up and process transfer using a combination of constant P/V and vvm as the criterion. Biotechnology Progress 33:1146-1159, 2017. Affiliations: Merck and Co. (Process Development and Engineering). Biopharma manufacturer. Abstract read.
- S38 Knoll A et al., High cell density cultivation of recombinant yeasts and bacteria under non-pressurized and pressurized conditions in stirred tank bioreactors. Journal of Biotechnology 132:167-179, 2007. Affiliations: RWTH Aachen University (Biochemical Engineering). Academic. Abstract read. Published before 2015.
- S39 Bylund F et al., Substrate gradient formation in the large-scale bioreactor lowers cell yield and increases by-product formation. Bioprocess Engineering (1998), doi 10.1007/s004490050427, 1998. Affiliations: Royal Institute of Technology (KTH) Stockholm. Academic, large-scale runs in an industrial vessel. Abstract read. Published before 2015.
- S40 Li F et al., A systematic approach for scale-down model development and characterization of commercial cell culture processes. Biotechnology Progress 22:696-703, 2006. Affiliations: Amgen Inc. (Process Engineering). Biopharma manufacturer. Abstract read. Published before 2015.